What California Cities Actually Legislate: Classifying Municipal Ordinances with CatLLM
Published:

Local laws shape daily life in ways that most people never see — your rent, your commute, what gets built on the corner lot — but they’re written in dense legal language, buried in city clerk archives, and produced at a volume no individual can keep up with. San Diego alone has passed nearly 90,000 ordinances and resolutions. San Francisco adds dozens per month. Journalists cover the headline votes; researchers study federal legislation; but the vast majority of municipal lawmaking happens without any systematic analysis at all.
cat-llm is designed to close that gap. It’s an open-source Python package that pulls municipal ordinances, federal laws, executive orders, and political speech directly from public datasets, then uses LLMs to classify, summarize, and analyze them at scale. It can take a 15,000-word ordinance written in statutory language and tell you, in plain English, what it does, who it affects, and where it falls on the political spectrum.
In this post, I used cat-llm to classify 200 recent ordinances each from San Diego and San Francisco — two major California cities with different political characters, against two classification schemes: a 12-category policy taxonomy and a 3-category political lean assessment. The goal: a quantitative snapshot of what these cities legislate about and whether the ideological differences between them show up in the text of their laws.
Want to run this on your own data? Skip to the methodology and replication section. The entire pipeline is open source and the datasets are public.
Background: cat-pol and the Data
cat-llm is an ecosystem of open-source Python packages that use LLMs to classify text at scale. Users interested specifically in political text analysis can install cat-pol (pip install cat-pol), which ships with 16 built-in political data sources on HuggingFace, including municipal ordinances from 12 California cities and counties, federal public laws, executive orders, presidential speeches, and Trump’s Truth Social posts, all accessible with a single source= parameter.
For this analysis, the data comes from two HuggingFace datasets:
- chrissoria/san-diego-ordinances — 87,983 records (ordinances + resolutions) going back to 1905
- chrissoria/sf-ordinances — 4,048 ordinances going back to 2011
Both datasets are scraped from official city clerk systems, include full ordinance text extracted from PDFs, and are updated weekly via automated scrapers. I took the 200 most recent ordinances with text from each city.
What follows is a demonstration of what you can learn from municipal legislation using a few lines of Python and no specialized legal knowledge. The entire analysis can be reproduced for free: the data is publicly hosted on HuggingFace, cat-llm is open source, and the classification can run on free-tier HuggingFace models or local models via Ollama with zero API costs. If you can write pip install cat-llm, you can replicate and extend every finding below.
San Francisco Passes Twice as Many Laws
Before asking what these cities legislate about, it’s worth asking how much they legislate.
| San Diego | San Francisco | |
|---|---|---|
| Ordinances per month (2020–2025 avg) | 11.2 | 22.2 |
| Ratio | 2.0x |
San Francisco passes roughly twice as many ordinances per month as San Diego: 22 vs 11. The pattern is stable across years, not a spike. SF consistently produces 20–25 ordinances per month; SD produces 9–15.
San Diego compensates with a high volume of resolutions (about 49 per month), which are administrative actions (contract approvals, budget items, proclamations) rather than new law. But in terms of actual lawmaking (text that creates, amends, or repeals municipal code), SF is substantially more productive.
This matters for everything that follows. When we compare the share of ordinances in each policy domain, we’re comparing slices of very different pies. A 24% business regulation rate in SF means roughly 5 new business ordinances per month. An 8% rate in SD means less than 1. Throughout the rest of this analysis, I’ll show both percentages and estimated monthly counts to keep the denominators honest.
What Do These Cities Legislate About?
Rather than imposing categories top-down, I used cat-llm’s extract function to discover 12 policy domains directly from the ordinance text. Categories are multi-label, so a single ordinance can be tagged with multiple domains. See the methodology section for how the categories were generated and the full list.
Results: Policy Domain Distribution
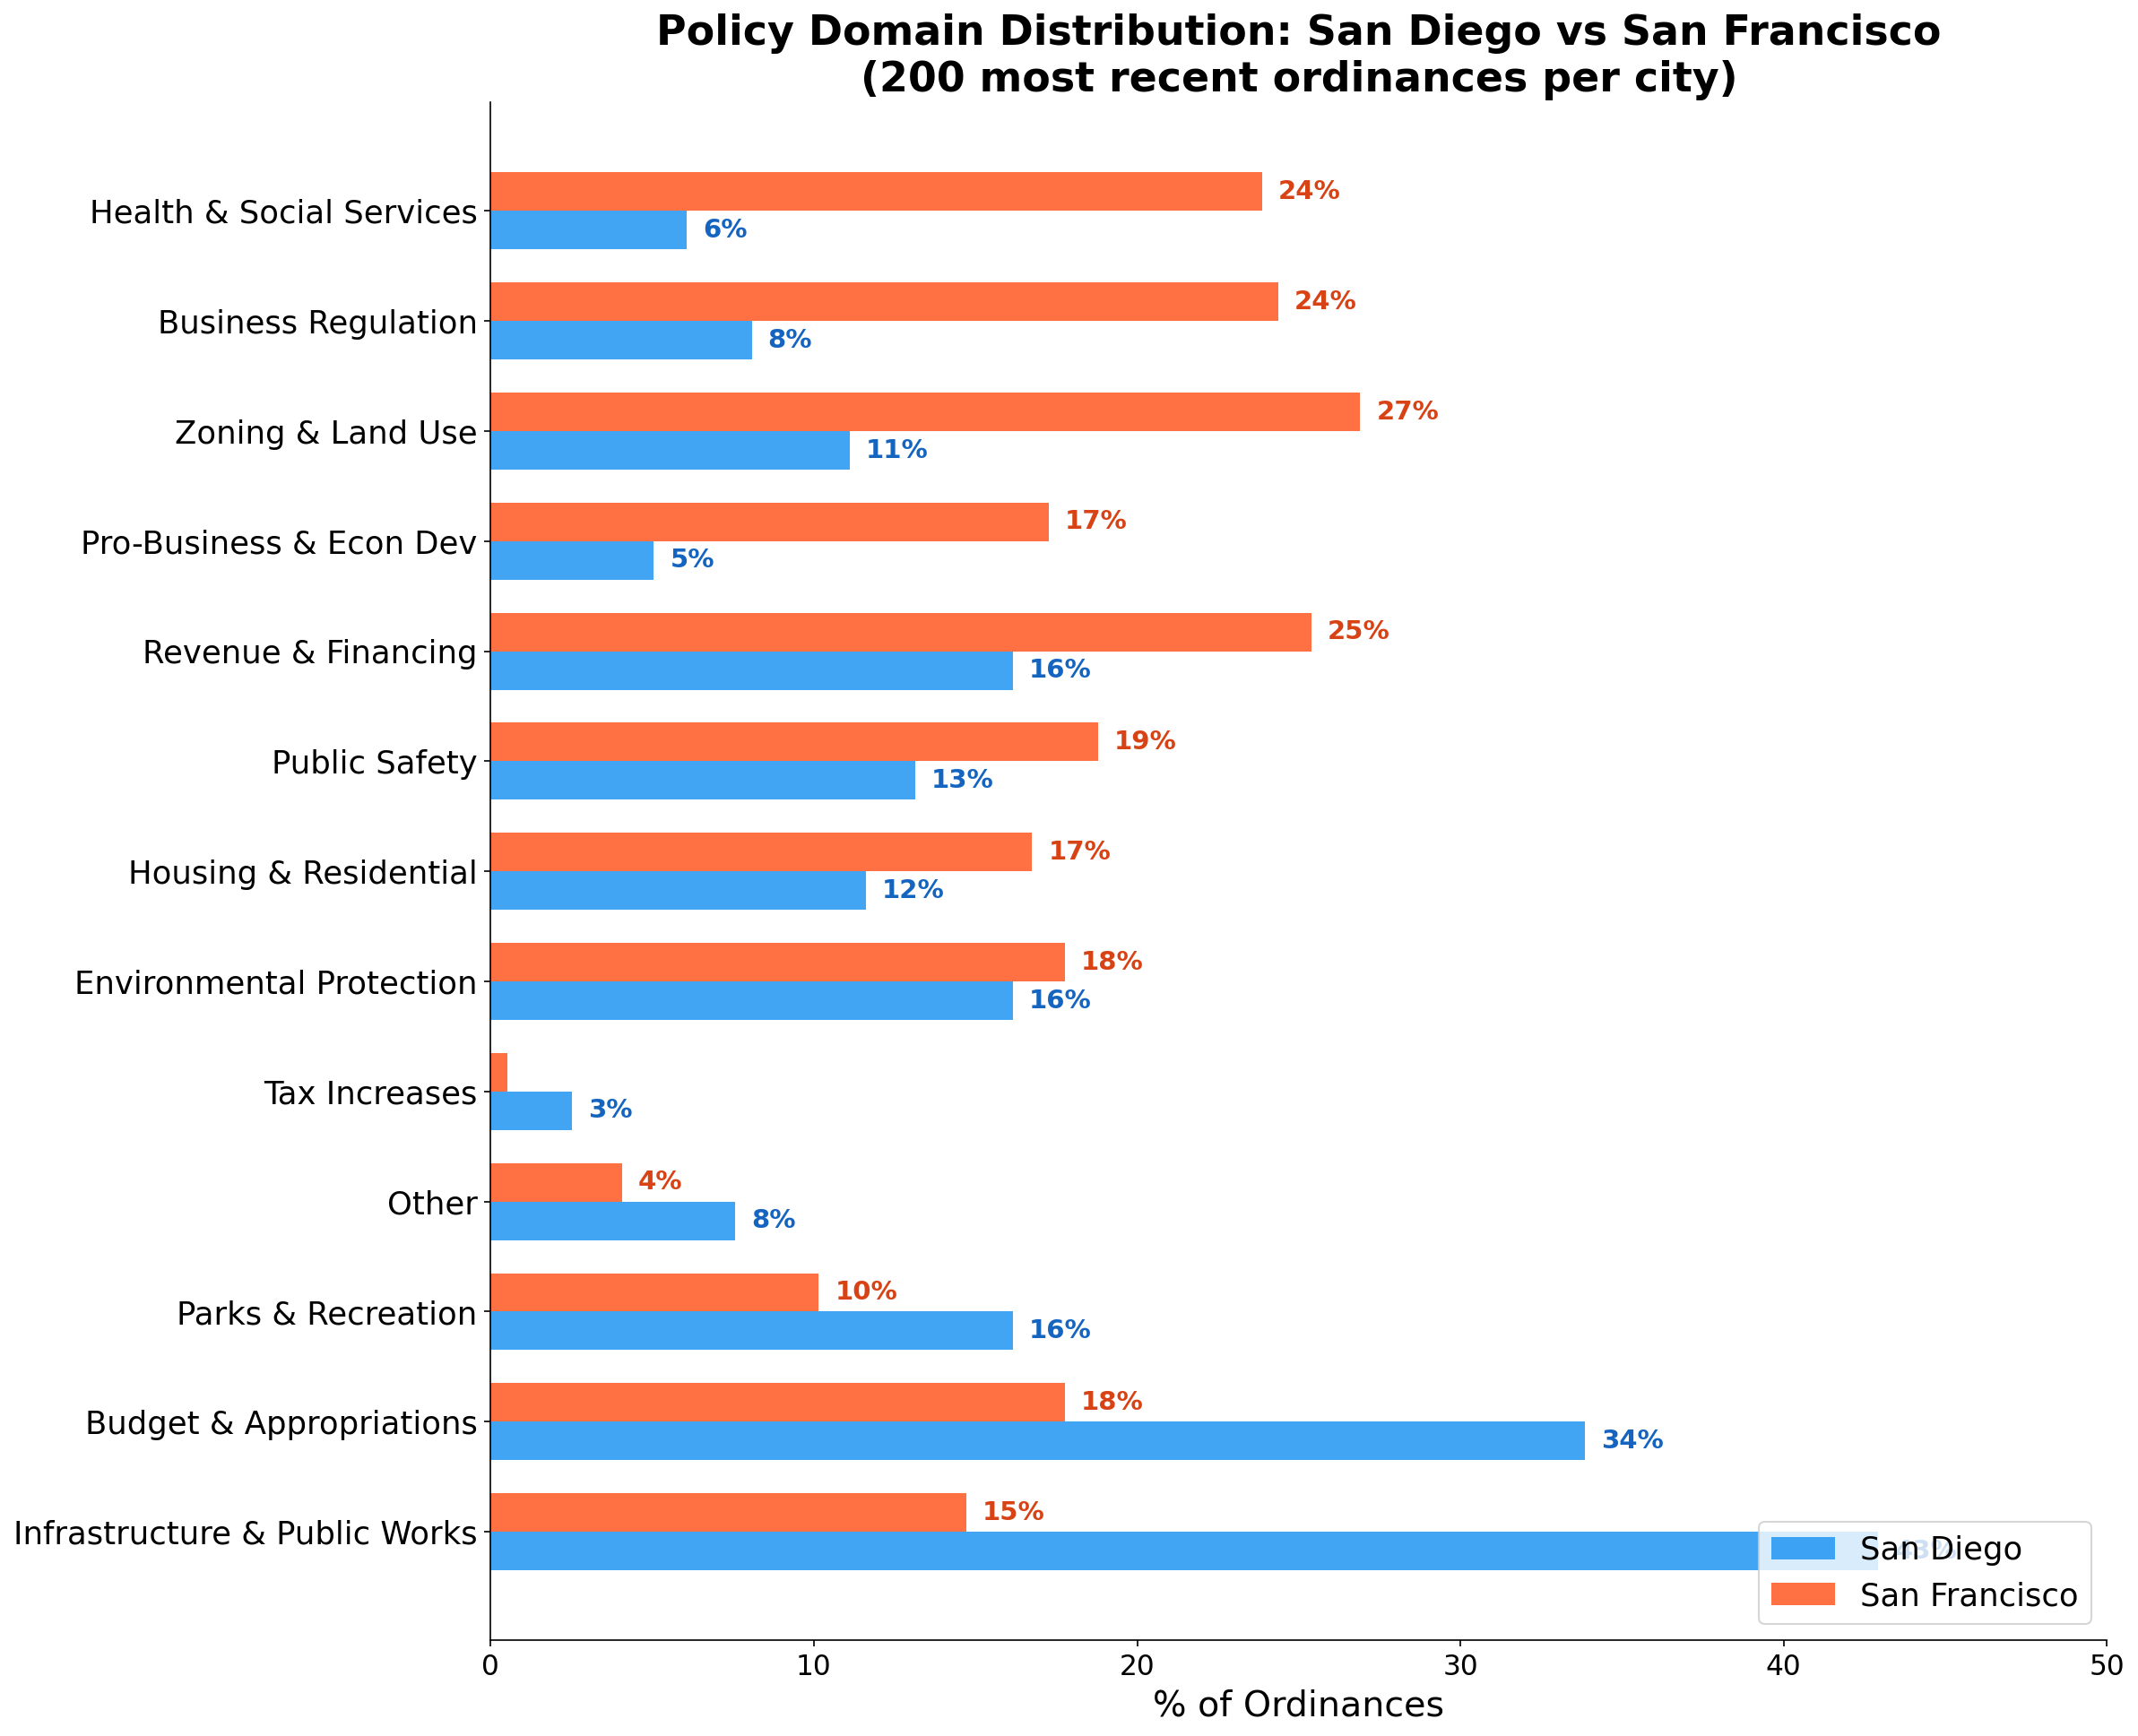
200 most recent ordinances per city. Multi-label (rows sum to >100%). Model: Qwen 2.5-72B-Instruct.
What the Numbers Mean
The two cities legislate about fundamentally different things.
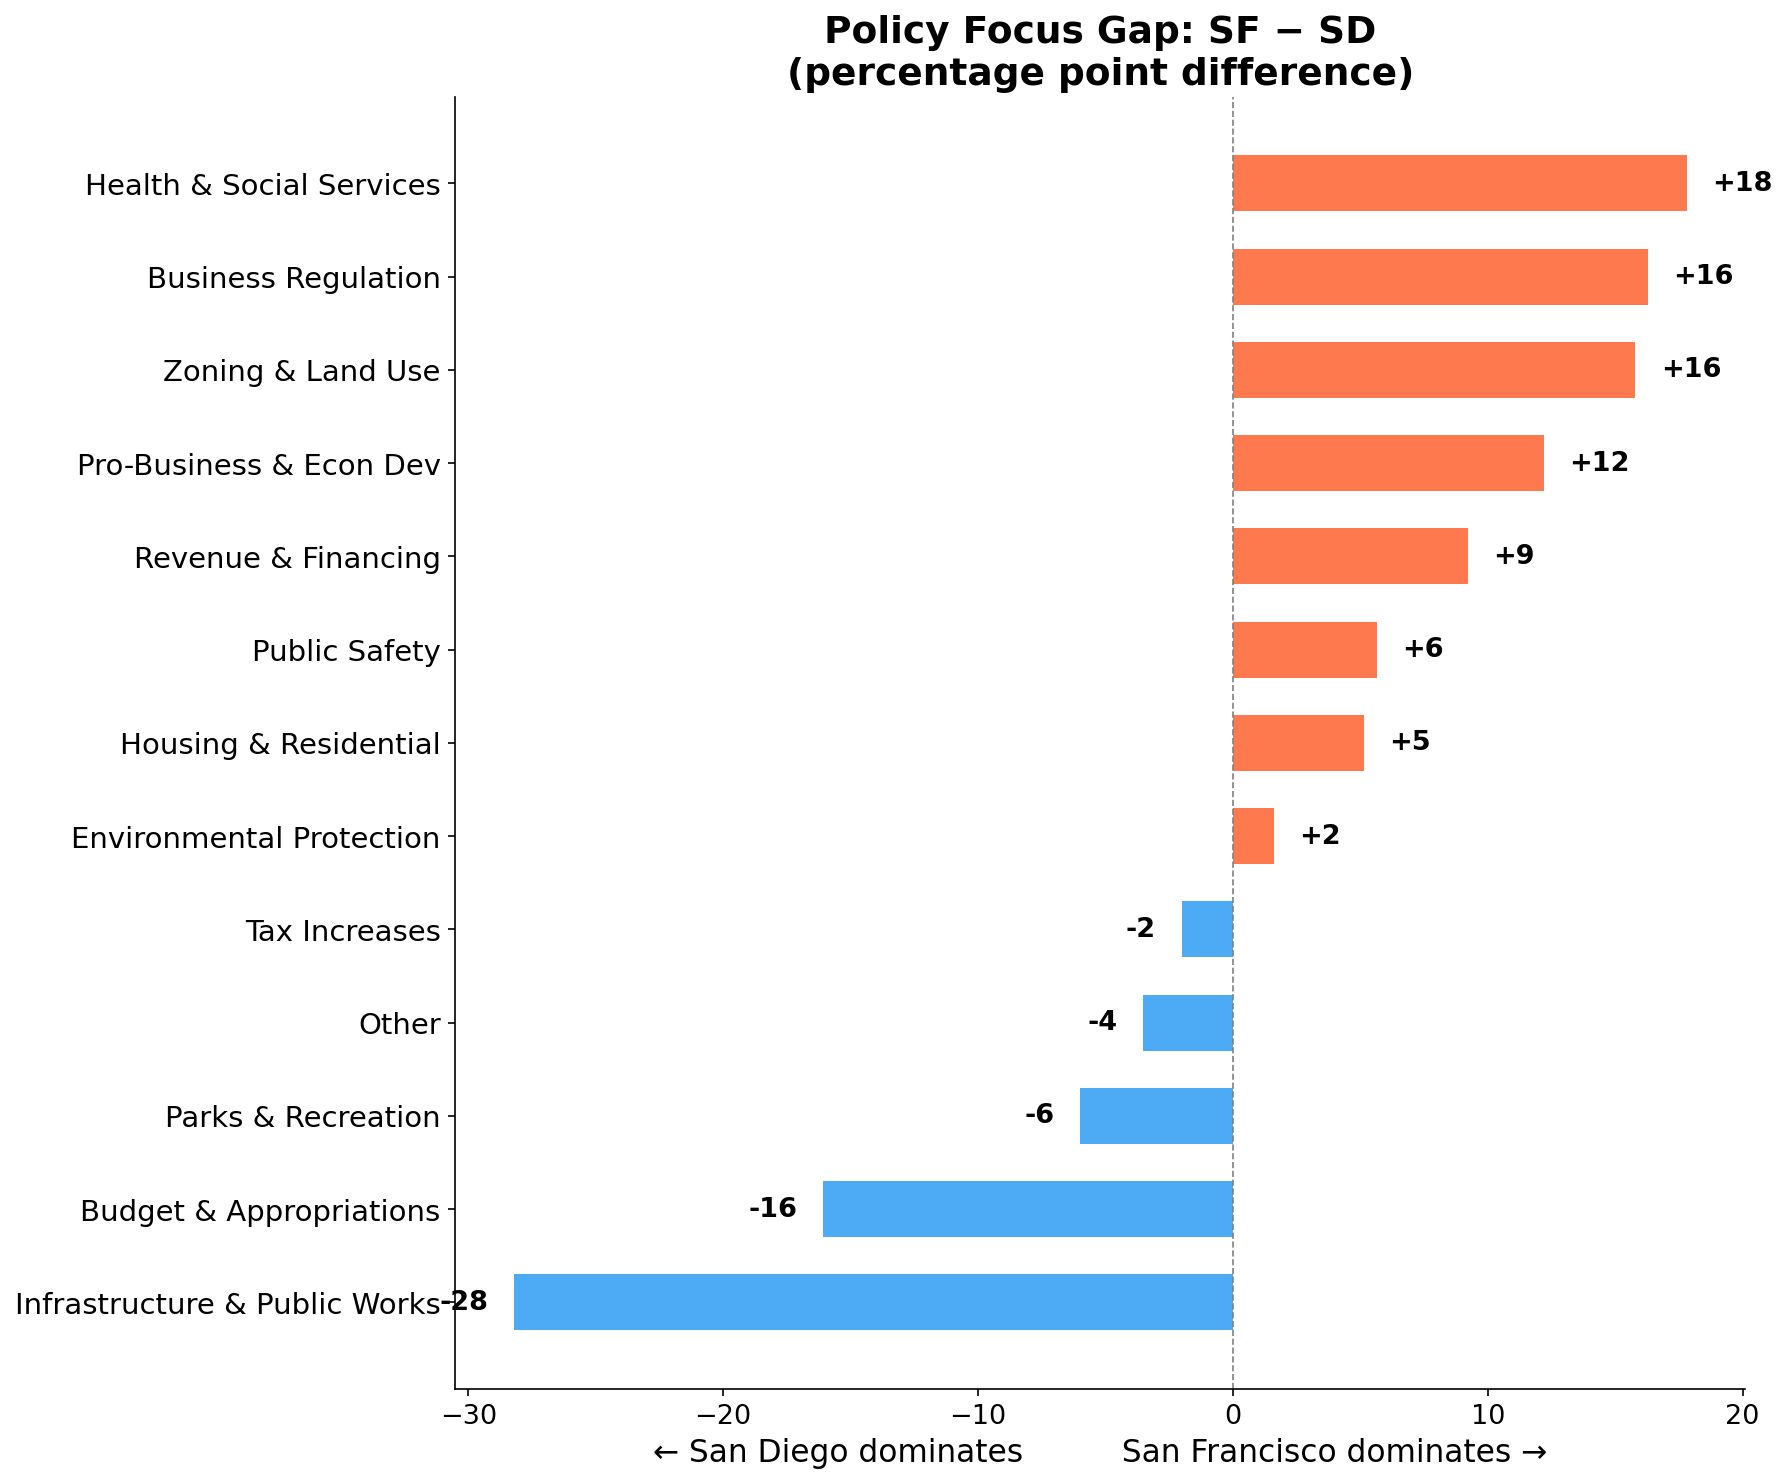
San Diego is a building city. Nearly half (43%) of its recent ordinances touch infrastructure and public works: road improvements, water main replacements, sewer projects, construction contract extensions. Even though SD passes half as many ordinances overall, it still produces more infrastructure legislation per month in absolute terms than SF (4.8 vs 3.3). This isn’t just proportional: SD is genuinely more active on physical infrastructure than SF is. The same holds for parks (1.8 vs 2.3/month, close despite SD’s half-sized legislative output). SD’s legislative agenda reads like a city physically constructing and maintaining itself.
San Francisco is a regulating city. Its ordinances spread across a wider range of policy domains, with no single category exceeding 27%. The biggest concentrations are in zoning and land use (6.0/month), revenue and financing (5.6/month), and business regulation (5.4/month). Health and social services, a category that barely registers in San Diego at 0.7 ordinances per month, hits 5.3 per month in SF. That’s not a rounding difference; it’s a 7x gap. Housing policy runs at roughly triple SD’s rate (3.7 vs 1.3/month). San Francisco’s legislative output reads like a city managing social complexity: who can build what, under what conditions, with what protections for whom.
The environmental protection rate is nearly identical between the two cities (~17%), suggesting this is a baseline concern for California municipalities regardless of political character. Tax increases are rare in both (under 3%), which likely reflects the political difficulty of explicit tax votes at the local level.
SF legislates more about business in both directions. San Francisco scores higher than San Diego on business regulation (24% vs 8%) and pro-business/economic development (17% vs 5%). It creates more rules and more incentives. San Diego’s approach to business is to leave it alone. The legislative silence is itself a policy choice.
SF actively raises revenue to fund social programs. SF generates 25% of its ordinances around revenue and financing, compared to SD’s 16%. Combined with SF’s 24% rate on health and social services (vs SD’s 6%), the picture is a city that raises money to fund an interventionist social agenda. San Diego raises less and spends what it raises on concrete: roads, pipes, parks.
Put differently: San Diego legislates like a city that wants to run well. San Francisco legislates like a city that wants to do good. Whether “doing good” through regulation and social programs actually produces better outcomes is a separate empirical question, but the legislative priorities are unmistakable in the data. SD’s council spends its time keeping the lights on and the water flowing. SF’s council spends its time deciding who gets housing protections, which businesses need new permits, and how to fund homelessness services.
As a robustness check, I re-ran the analysis on 1,000 ordinances per city using GPT-4o with a different, data-driven category scheme. Different model, five times the sample, looser categories. Same conclusion: SD dominates on infrastructure and construction; SF dominates on health, environment, and housing. The pattern holds.
Part 2: Do Ordinances Have a Political Lean?
Category Setup
For the political lean analysis, I used three categories designed to capture ideological orientation:
Conservative/Right-Leaning Policy — deregulation, tax cuts, pro-business measures, law enforcement expansion, property rights protections, reduced government intervention, privatization of services
Progressive/Left-Leaning Policy — new regulations, tax increases, tenant protections, environmental mandates, social services expansion, equity/inclusion initiatives, labor protections, police reform
Neutral — routine contract approvals, procedural amendments, election scheduling, civil service appointments, budget housekeeping with no policy direction
This classification used Qwen3-235B, the flagship thinking model, to see whether reasoning capability helps with the more nuanced task of ideological classification.
Results: Political Lean Distribution
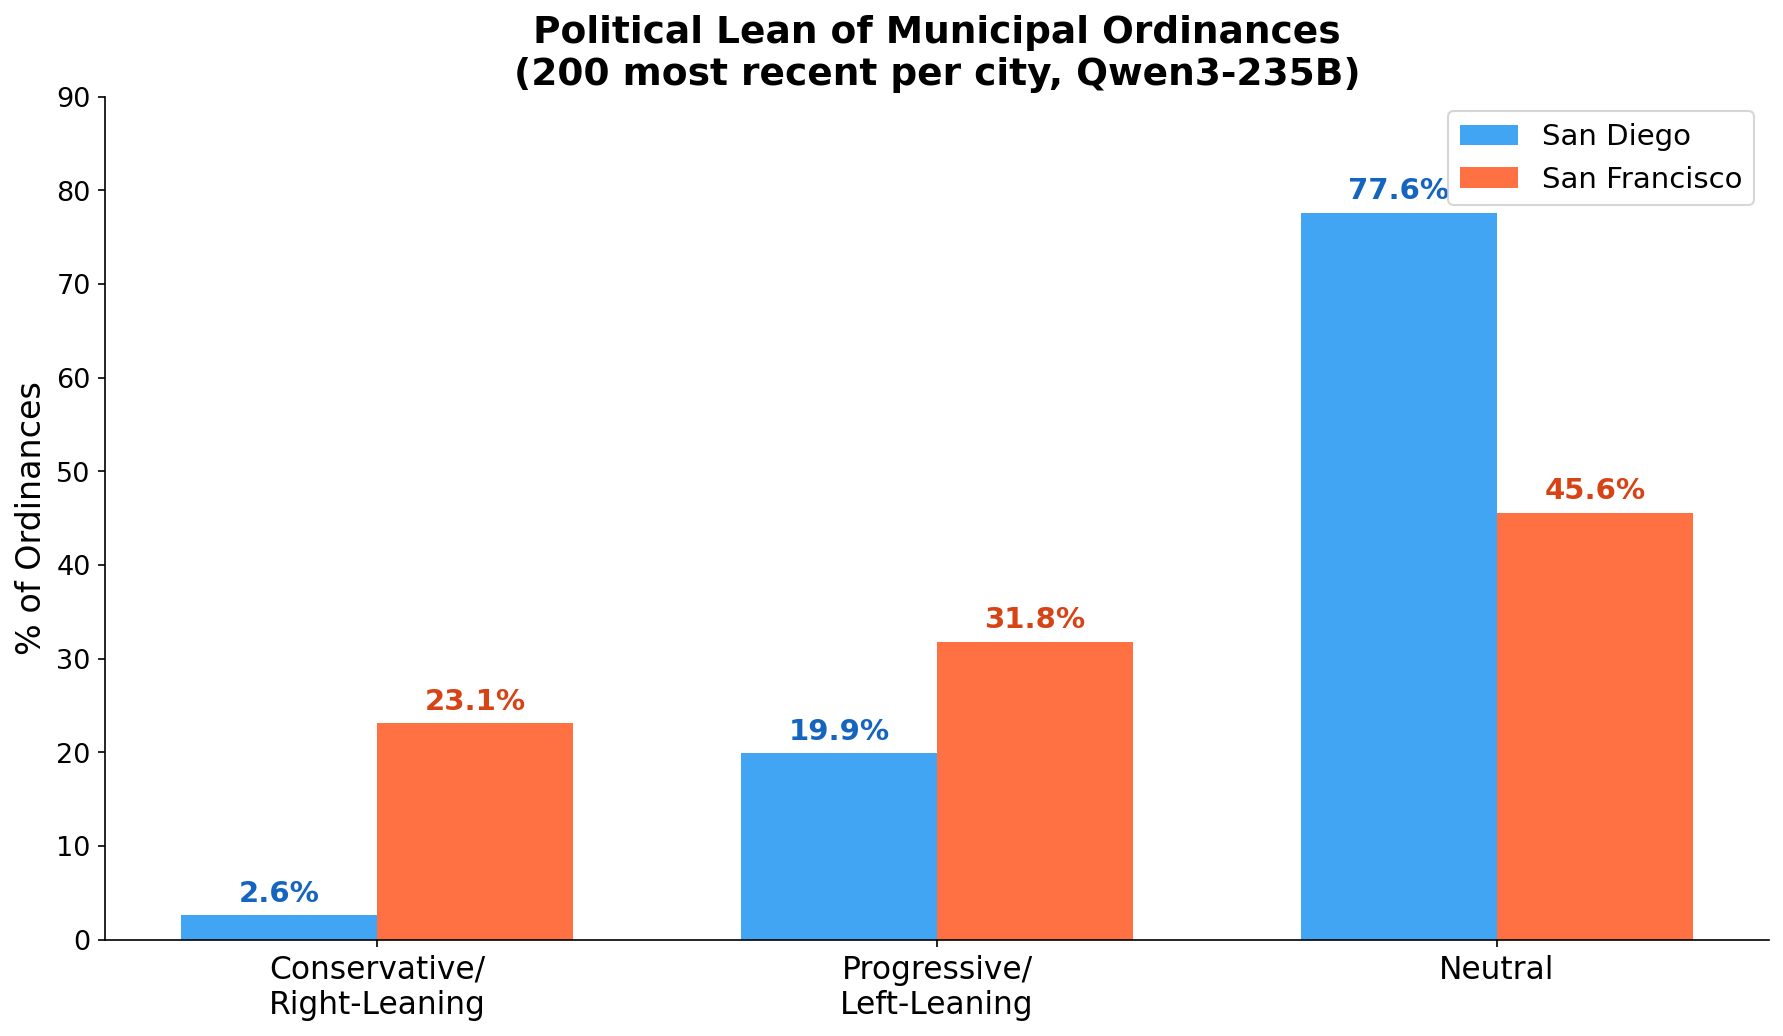
| San Diego | San Francisco | |
|---|---|---|
| Conservative/Right-Leaning | 2.6% | 23.1% |
| Progressive/Left-Leaning | 19.9% | 31.8% |
| Neutral | 77.6% | 45.6% |
200 most recent ordinances per city. Multi-label classification. Model: Qwen3-235B (thinking model).
The results are counterintuitive, and that’s what makes them interesting.
San Diego’s ordinances are overwhelmingly neutral. Nearly 78% of SD’s recent ordinances carry no detectable ideological lean. These are contract extensions, budget transfers, construction authorizations. The machinery of a city that governs by administration rather than ideology. Only 3% code as conservative and 20% as progressive.
San Francisco legislates politically in both directions. SF has a higher progressive rate (32% vs 20%), which aligns with expectations. But the surprise is SF’s conservative rate: 23% vs SD’s 3%. San Francisco produces nearly 9x more conservative-coded ordinances than San Diego.
This isn’t because San Francisco has a secret conservative agenda. It’s because SF actively legislates about the domains that register as ideological: business regulation, tax policy, development incentives, policing. When you pass an ordinance streamlining permits for small businesses, that codes as pro-business/conservative. When you pass an ordinance adding tenant protections, that codes as progressive. San Diego doesn’t pass either ordinance. It passes a contract amendment instead.
The neutral rate tells the real story. SD’s 78% neutral rate means its city council spends most of its time on administrative governance. SF’s 46% neutral rate means less than half of its legislative output is purely procedural. The majority of SF ordinances take a policy stance of some kind. SF doesn’t just lean left — it legislates ideologically, period. It takes more stances in more directions than San Diego takes in any direction.
Methodology Notes
A few important details about how this analysis works and where it might break.
Multi-label classification. Each ordinance can be tagged with multiple categories simultaneously. An infrastructure bond gets both “Infrastructure” and “Revenue and Financing.” This means percentages sum to more than 100%. That’s by design, not a bug.
Model choice. I used two models: Qwen 2.5-72B-Instruct for the 12-category policy domain classification and Qwen3-235B (a 235-billion parameter mixture-of-experts thinking model) for the political lean analysis. Both are open-source models accessed via HuggingFace’s inference API, no OpenAI dependency. The robustness check used GPT-4o on a larger sample to confirm the results hold across model families.
Category discovery. Categories weren’t hand-picked. I used catllm.extract_policy() to sample 50 ordinances and let the LLM discover recurring themes, then semantically merged duplicates into a clean taxonomy. The specificity="specific" parameter ensures category names include examples, which significantly improves classification accuracy over bare labels. The 12 policy domain categories used:
- Tax Increases 2. Revenue and Financing 3. Budget and Appropriations 4. Housing and Residential Development 5. Zoning and Land Use Changes 6. Infrastructure and Public Works 7. Business Regulation 8. Pro-Business and Economic Development 9. Environmental Protection 10. Public Safety 11. Health and Social Services 12. Parks, Recreation, and Culture
For the political lean analysis, three categories: Conservative/Right-Leaning Policy, Progressive/Left-Leaning Policy, and Neutral.
Limitations. There’s no ground truth here — no human-coded comparison set for municipal ordinances. The classifications reflect what the model thinks these ordinances are about, not an objective standard. Model bias is a real concern, especially for the political lean analysis; LLMs have known tendencies in how they interpret political language. The sample sizes (200 for the Qwen runs, 1,000 for the GPT-4o robustness check) are reasonable but not exhaustive. The full classified datasets (1,700 SD ordinances, 3,900 SF ordinances) are now public on HuggingFace for anyone who wants to validate or extend this analysis.
The Public Datasets
All data and classification results are publicly available:
- San Diego ordinances: chrissoria/san-diego-ordinances (87,983 records)
- San Francisco ordinances: chrissoria/sf-ordinances (4,048 records)
- Classification results:
The source registry includes 16 datasets across California cities and counties, federal legislation, and social media:
import catllm

catllm.list_policy_sources()  # see all 16 sources
How to Run It Yourself
pip install cat-llm          # full ecosystem
# or: pip install cat-pol    # just the political text package
import catllm

# Discover categories from your data
categories = catllm.extract_policy(
    source="city_san_diego",
    doc_type="ordinance",
    n=50,
    api_key="your-key",
    user_model="Qwen/Qwen2.5-72B-Instruct",
    model_source="huggingface",
    max_categories=12,
    specificity="specific",
)

# Classify using discovered categories
results = catllm.classify_policy(
    source="city_san_diego",
    categories=categories["top_categories"],
    doc_type="ordinance",
    n=200,
    api_key="your-key",
    user_model="Qwen/Qwen2.5-72B-Instruct",
    model_source="huggingface",
)

# Summarize in plain language
summaries = catllm.summarize_policy(
    source="city_san_diego",
    n=10,
    format="bullets",
    tone="eli5",
    api_key="your-key",
)

# Optimize prompts with user feedback
result = catllm.prompt_tune_policy(
    source="city_san_diego",
    categories=["Housing", "Public Safety", "Finance"],
    api_key="your-key",
    sample_size=15,
)

# Fetch raw data (no API key needed)
df = catllm.fetch_policy_source("city_san_diego", n=100, doc_type="ordinance")
cat-llm handles the data pull, classification, and output in a consistent pipeline. Every dataset in the registry uses the same source= parameter across all six functions (classify_policy, extract_policy, explore_policy, summarize_policy, prompt_tune_policy, fetch_policy_source).
What This Tells Us
The consistent finding across every analysis (different models, different sample sizes, different category schemes) is that San Diego and San Francisco govern in fundamentally different modes.
San Diego governs through administration: infrastructure projects, contract management, budget operations. Its ordinances are largely neutral, procedural, and focused on keeping the physical city running. When SD does legislate on policy, it tilts modestly progressive, but most of its legislative energy goes to the apolitical work of urban maintenance.
San Francisco governs through policy: zoning, business regulation, health services, housing, environmental mandates. Its ordinances are more likely to carry an ideological valence, progressive and conservative — because SF actively codifies political values into law. It produces twice as many ordinances per month, and more than half of them take a policy stance.
Neither mode is inherently better. SD’s approach keeps government lean and focused; SF’s approach uses legislation as a tool for social intervention. But the data makes clear that these aren’t just different political leanings. They’re different theories of what city government is for.
What’s Next
This analysis covers two cities. cat-pol ships with 16 data sources (and growing): 12 California cities, San Diego County, federal public laws, executive orders, presidential speeches, and Trump’s Truth Social posts. The same classification pipeline can be applied to any of them. Some questions I haven’t answered:
- Time series: Has SF always been this regulatory, or did it shift after a particular election?
- City-size effects: Do smaller cities (Salinas, Clovis) look more like SD or SF?
- County vs city: SD County just went live as a dataset — does county governance look different from city governance in the same jurisdiction?
- Federal comparison: How do municipal policy domains map onto federal legislation?
If you build something with cat-pol or the datasets, reach out at chrissoria@berkeley.edu.