
What Bluesky’s Most-Followed Accounts Actually Post About
Published:

A few days ago I used cat-vader to analyze my own Threads feed — 582 posts, 9 categories, and a slightly uncomfortable amount of self-reflection. That analysis asked a personal question: what do I post about?
This one asks a broader question. I took the same classification pipeline and pointed it at ten of Bluesky’s most-followed accounts: AOC, Mark Cuban, Mark Hamill, The Onion, George Takei, The New York Times, Rachel Maddow, Stephen King, MeidasTouch, and NPR. These accounts span the ecosystem — a sitting congresswoman, a billionaire, a pop culture icon, a satirical news outlet, two major media organizations, an advocacy network, and a horror novelist. 250 posts per account, 2,500 posts total, all classified by GPT-4o-mini against a nine-category scheme.
What do Bluesky’s most-followed accounts post about? And more interestingly: once you control for who is posting, does content type actually predict engagement?
Background: cat-vader and the Dataset
cat-vader is a fork of my open-source survey classification package cat-llm, adapted for social media analysis. The core idea is simple: you give it a list of posts and a set of categories with descriptions, and it uses an LLM to check each post against each category independently. Because categories aren’t mutually exclusive, a single post can belong to multiple categories simultaneously — a Rachel Maddow post about deportation policy might be tagged as both Politics & Elections and Social Issues & Justice. That multi-label design is what makes the output useful for analysis rather than just binning.
For this analysis I pulled 250 posts from each of ten accounts using cat-vader’s sm_source="bluesky" integration, classified them all using GPT-4o-mini, and exported everything to a single CSV that’s now publicly available on Hugging Face at chrissoria/bluesky-top10-classified.
One important note before diving in: Bluesky’s API returns views = 0 for all posts. The platform either doesn’t track impression counts or doesn’t expose them. That means the engagement analysis here focuses entirely on likes and replies — two signals that are real and public, but not the same as reach.
Category Setup
Before running classification, I defined nine categories designed to capture the thematic range of these accounts. Rather than bare labels, each category gets a description that guides the model on borderline cases.
1. Politics & Elections — Posts about electoral dynamics, political parties, voting, candidates, or partisan maneuvering. Includes commentary on legislative proceedings, election results, and the behavior of political figures as political actors.
“I honestly believe our most powerful position in a toxic time that feeds on cynicism, apathy, & despair is to genuinely care and act for a better world.” — Alexandria Ocasio-Cortez (146,230 likes)
2. Trump & MAGA Criticism — Posts directly targeting Donald Trump, his administration, his supporters, or the MAGA movement. Includes both policy critiques and character commentary.
“Trump Suffers Setback Unrelated To Child Rape” — The Onion (10,746 likes)
3. Social Issues & Justice — Posts about systemic inequality, civil rights, immigration enforcement, discrimination, or other social conditions. Focus is observational or normative rather than electoral.
“The owners of a Dallas County warehouse that ICE had planned to use as a mega detention center said Monday it will not sell or lease the property to the federal government. ‘God answered our prayers,’ the Hutchins Mayor said.” — Rachel Maddow (21,132 likes)
4. News & Current Events — Posts reporting on, linking to, or discussing recent news stories across any domain. Includes breaking news, investigative stories, and news aggregation.
“An NPR investigation finds the public database of Epstein files is missing dozens of pages related to sexual abuse accusations against President Trump.” — NPR (10,185 likes)
5. Entertainment & Pop Culture — Posts about film, television, music, celebrity, sports, books, or cultural moments. Includes personal fandom and cultural commentary.
“Bluesky is collegial and interesting, the way Twitter used to be. Bonus: most people can spell.” — Stephen King (80,664 likes)
6. Humor & Satire — Posts that are primarily comedic in intent: jokes, satirical takes, absurdist commentary, or ironic framings of current events.
“Netanyahu Calls Iran Strikes Necessary To Prevent War He Just Started” — The Onion (23,571 likes)
7. Science & Technology — Posts about scientific findings, technology developments, AI, climate science, medicine, or the intersection of tech and society.
8. Economy & Business — Posts about financial markets, economic conditions, corporate news, consumer prices, trade policy, or business developments.
“Mr. Cuban — I just wanted to quickly thank you. My husband has [cancer]. We went to pick up his medication and were informed it was $29,000. We were able to get it from CostPlus for $99.” — Mark Cuban (12,276 likes)
9. Personal & Lifestyle — Posts that are personal in nature: life updates, reflections, expressions of mood, personal milestones, or non-political opinion.
“We were married on this day in 1978… soulmates ever since.” — Mark Hamill (53,889 likes)
What Bluesky’s Top Accounts Post About
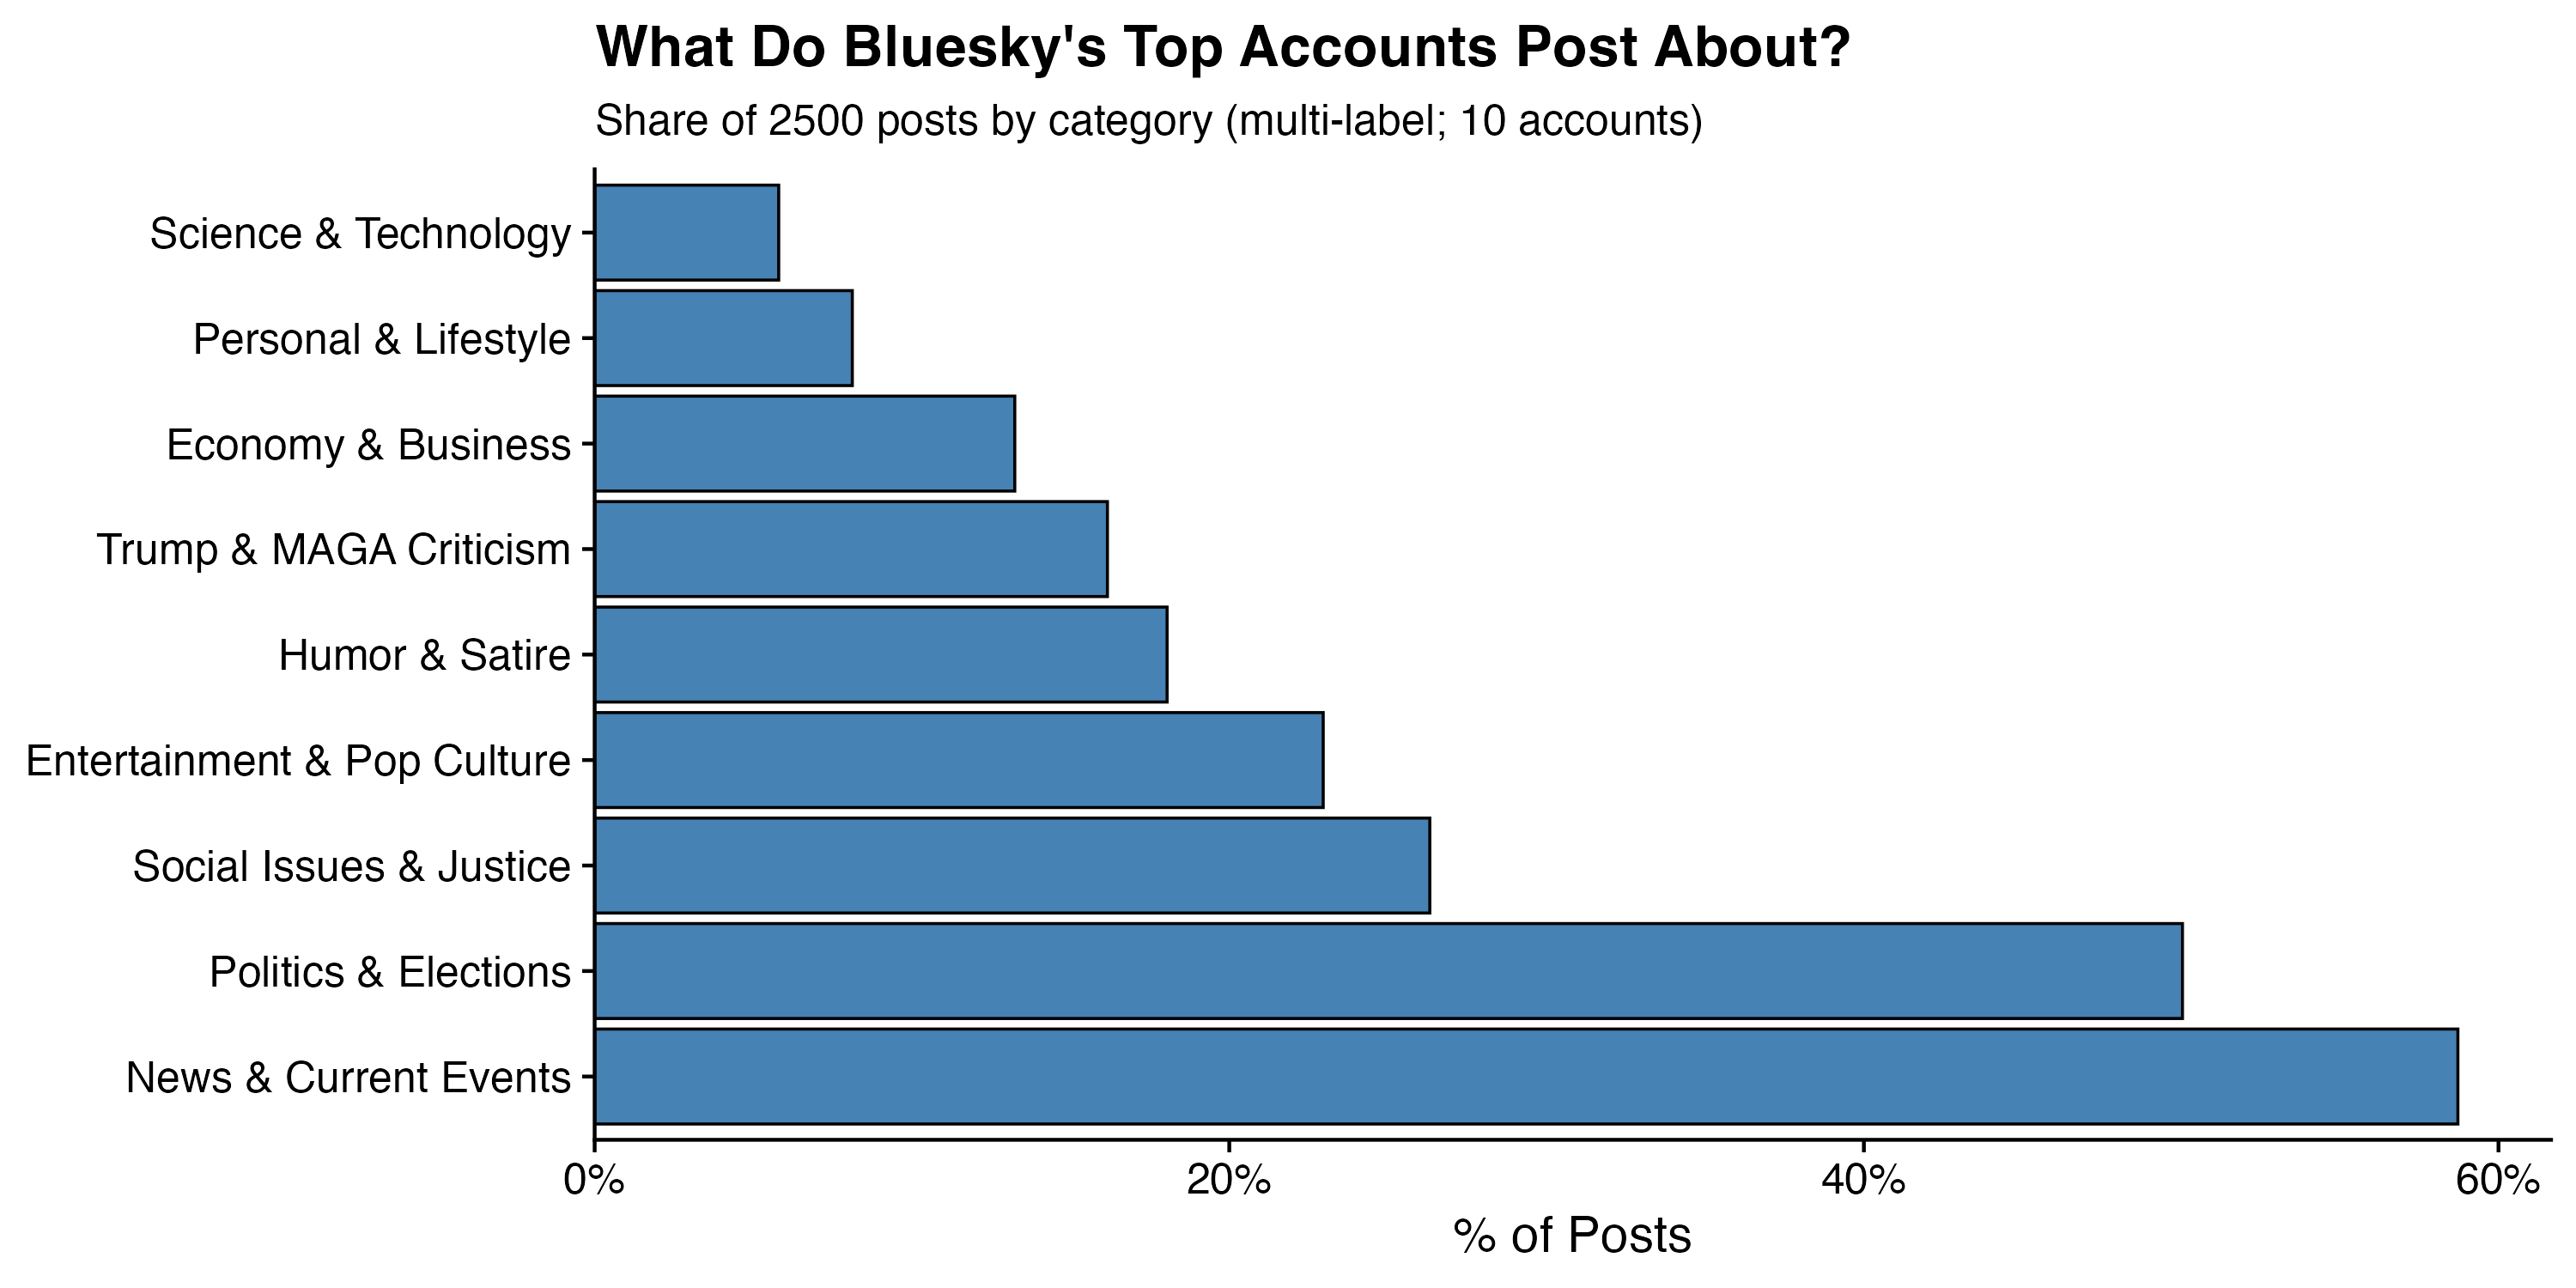
The overall landscape has a clear hierarchy. News & Current Events dominates at 58.7% of all 2,500 posts — nearly three in five posts link to or discuss a recent story. Politics & Elections comes in second at 50.0%, meaning half of all posts across these accounts touch on politics in some form. Then there’s a significant drop to Social Issues & Justice (26.3%), Entertainment & Pop Culture (23.0%), and Humor & Satire (18.0%). Trump & MAGA Criticism sits at 16.2%. At the bottom: Economy & Business (13.2%), Personal & Lifestyle (8.1%), and Science & Technology (5.8%).
The concentration at the top isn’t surprising for this particular set of accounts — these aren’t lifestyle influencers or tech reviewers. But the degree of dominance by News and Politics is still striking. More than half of what this slice of Bluesky produces is essentially political journalism or political commentary.
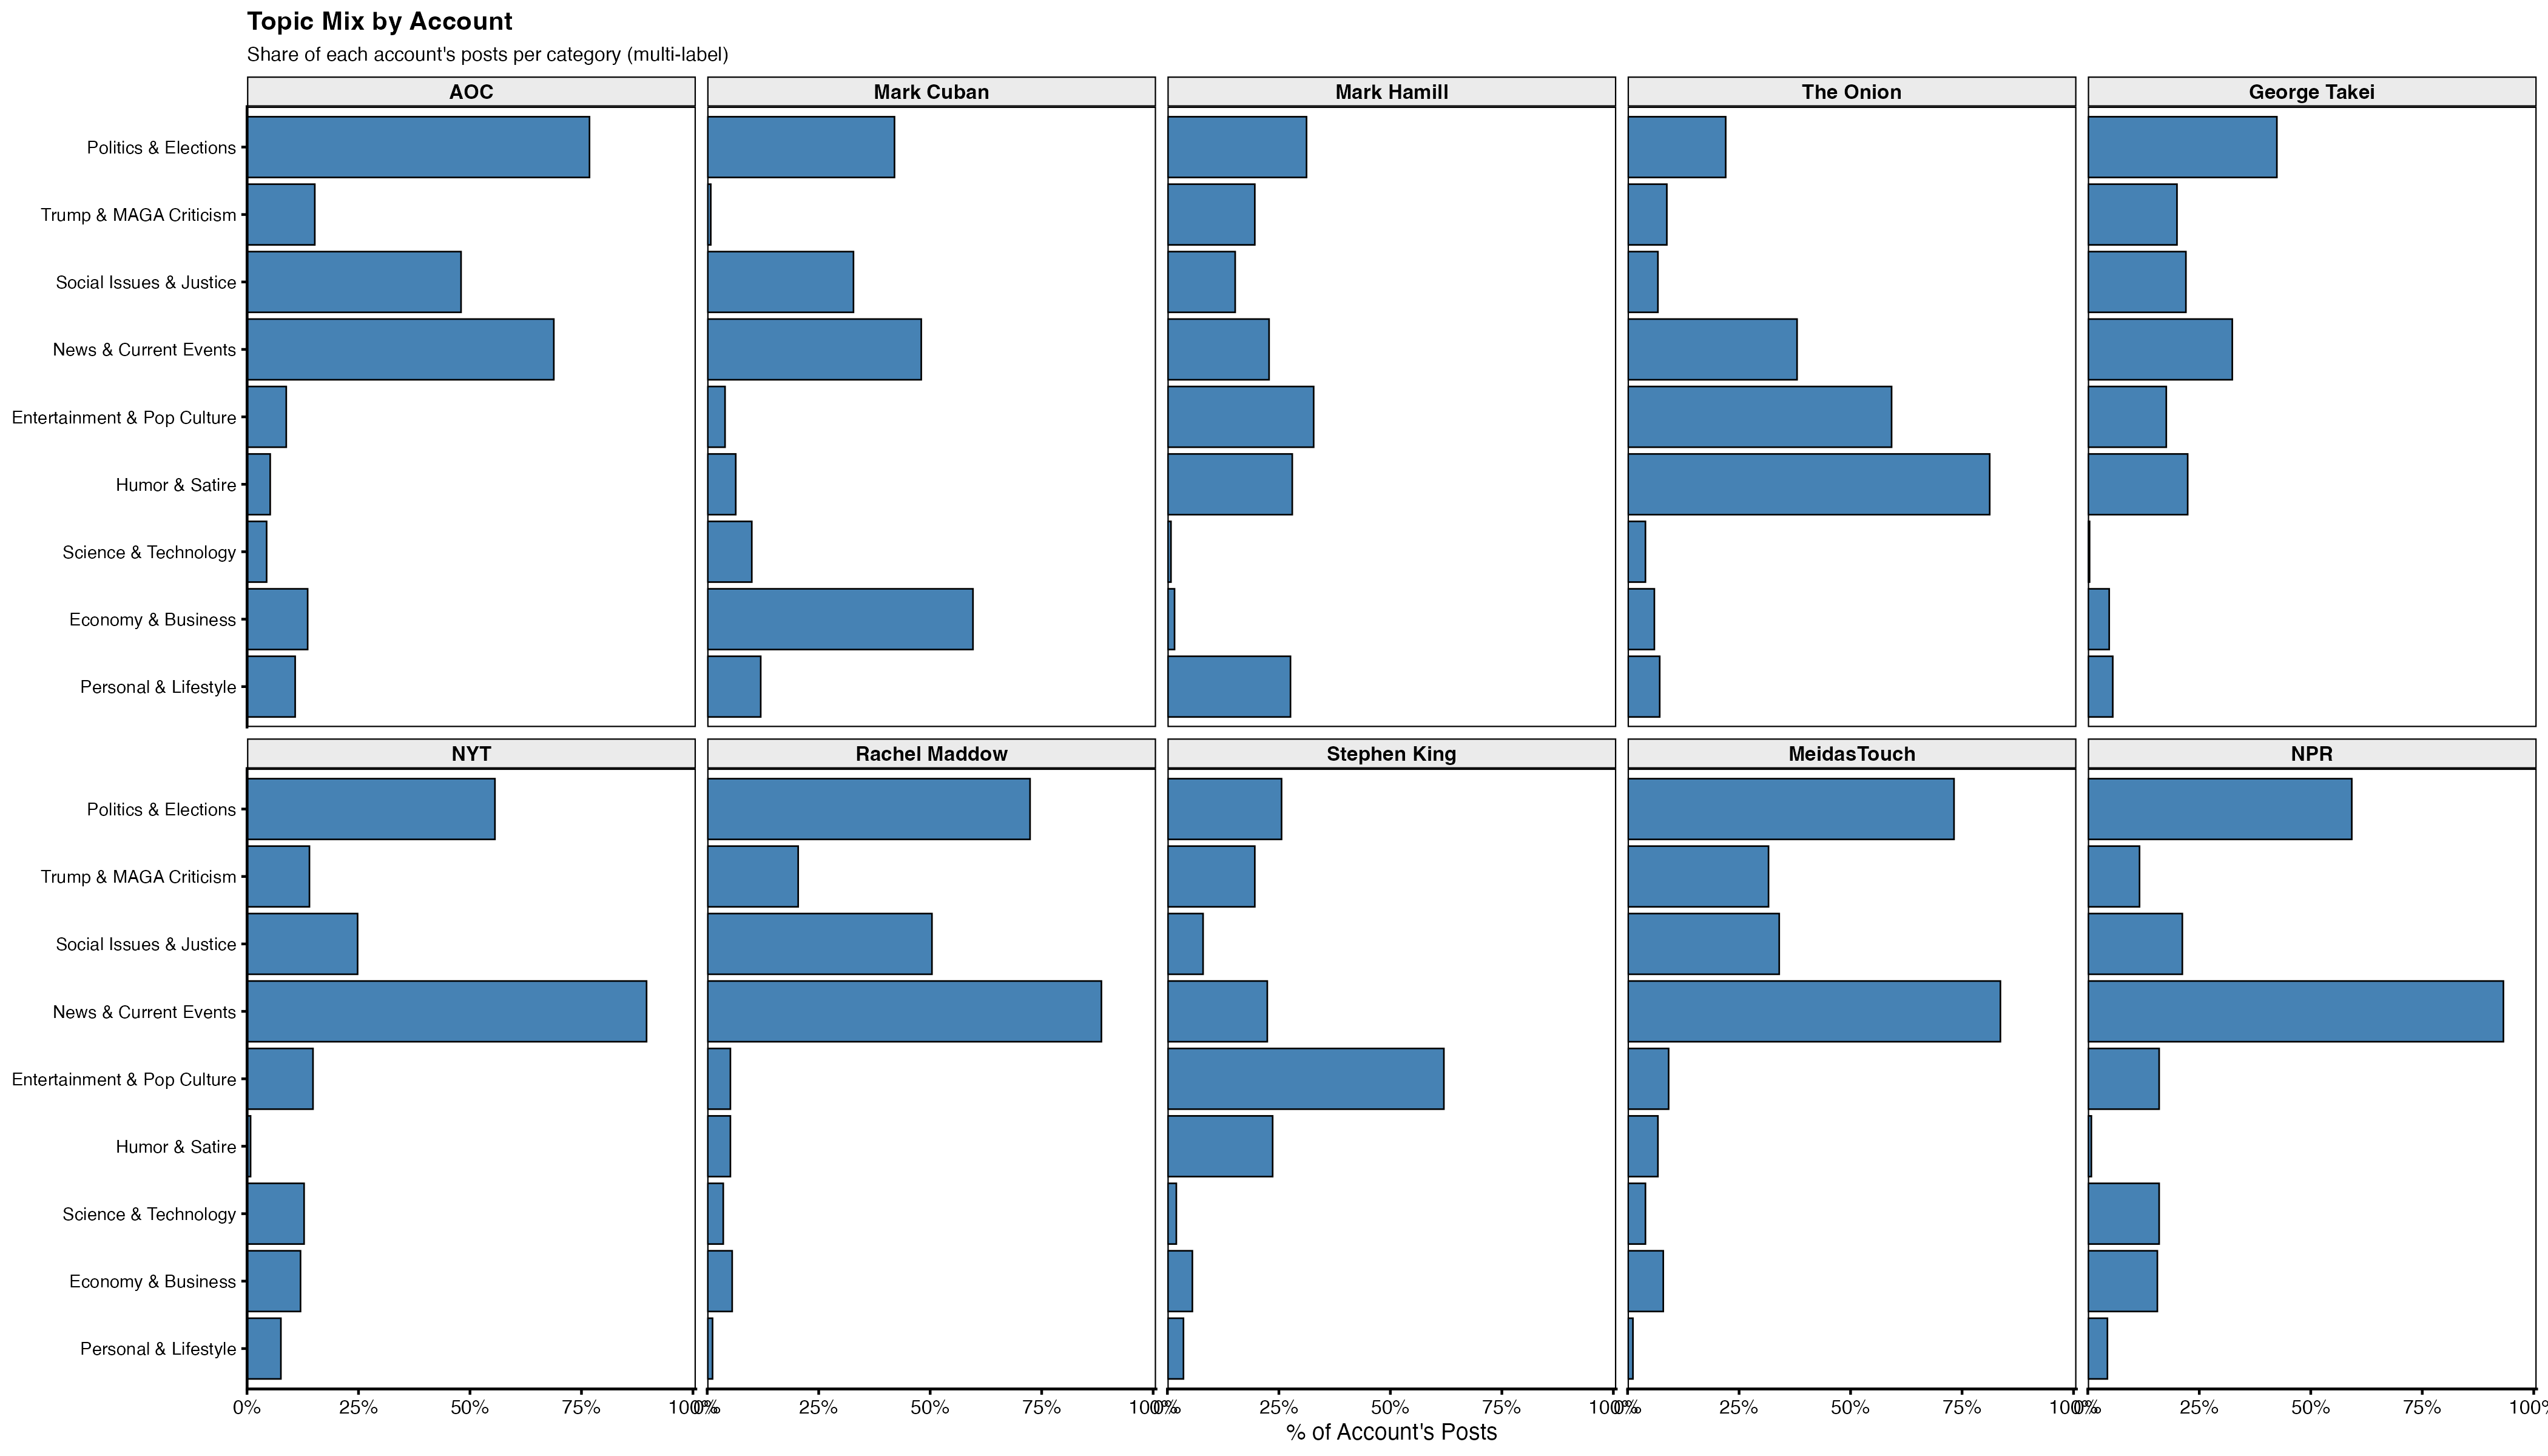
The account-level breakdown is where things get interesting.
NPR is the most single-mindedly focused: 93% of its posts fall under News & Current Events, and 60% under Politics & Elections. Almost nothing else. The Humor & Satire bar is essentially invisible (1%). NPR’s Bluesky presence is a straight news wire.
The Onion is the mirror image in the best way. 81% of Onion posts are tagged Humor & Satire — the highest satire rate of any account — but also 60% Entertainment & Pop Culture. What’s slightly surprising is that only 21% of The Onion’s posts are tagged Politics & Elections directly, and only 9% Trump & MAGA Criticism. Satirical headlines about Trump do get tagged politics when the framing is explicitly electoral, but a lot of Onion content uses political subjects in the service of pure absurdism, which the model correctly separates out.
AOC leads in Politics & Elections (68% of her posts), Social Issues & Justice (36%), and News & Current Events (55%). Almost no Humor, very little Economy. Her Bluesky presence reads like exactly what it is: a member of Congress doing political communication full-time.
Mark Cuban is the biggest outlier in the dataset. He’s the only account where Economy & Business is the dominant theme at 58% — more than any other category. He’s also one of the few accounts where Trump & MAGA Criticism is near zero (under 1%). Cuban posts about healthcare costs, business models, tariff economics, and policy mechanics. His account has almost nothing in common with the others topically.
Stephen King is the most balanced. He mixes Entertainment & Pop Culture (62%), Politics & Elections (27%), Humor & Satire (23%), and News & Current Events (24%) roughly evenly. His account feels like a person who actually posts about many things, not a media organization running a content strategy.
Mark Hamill tilts heavily toward Entertainment & Pop Culture (based on his posting about Star Wars, his marriage, personal reflections) alongside Politics — a mix that reflects his public persona as both a cultural figure and a vocal political voice.
Who Gets the Most Engagement?
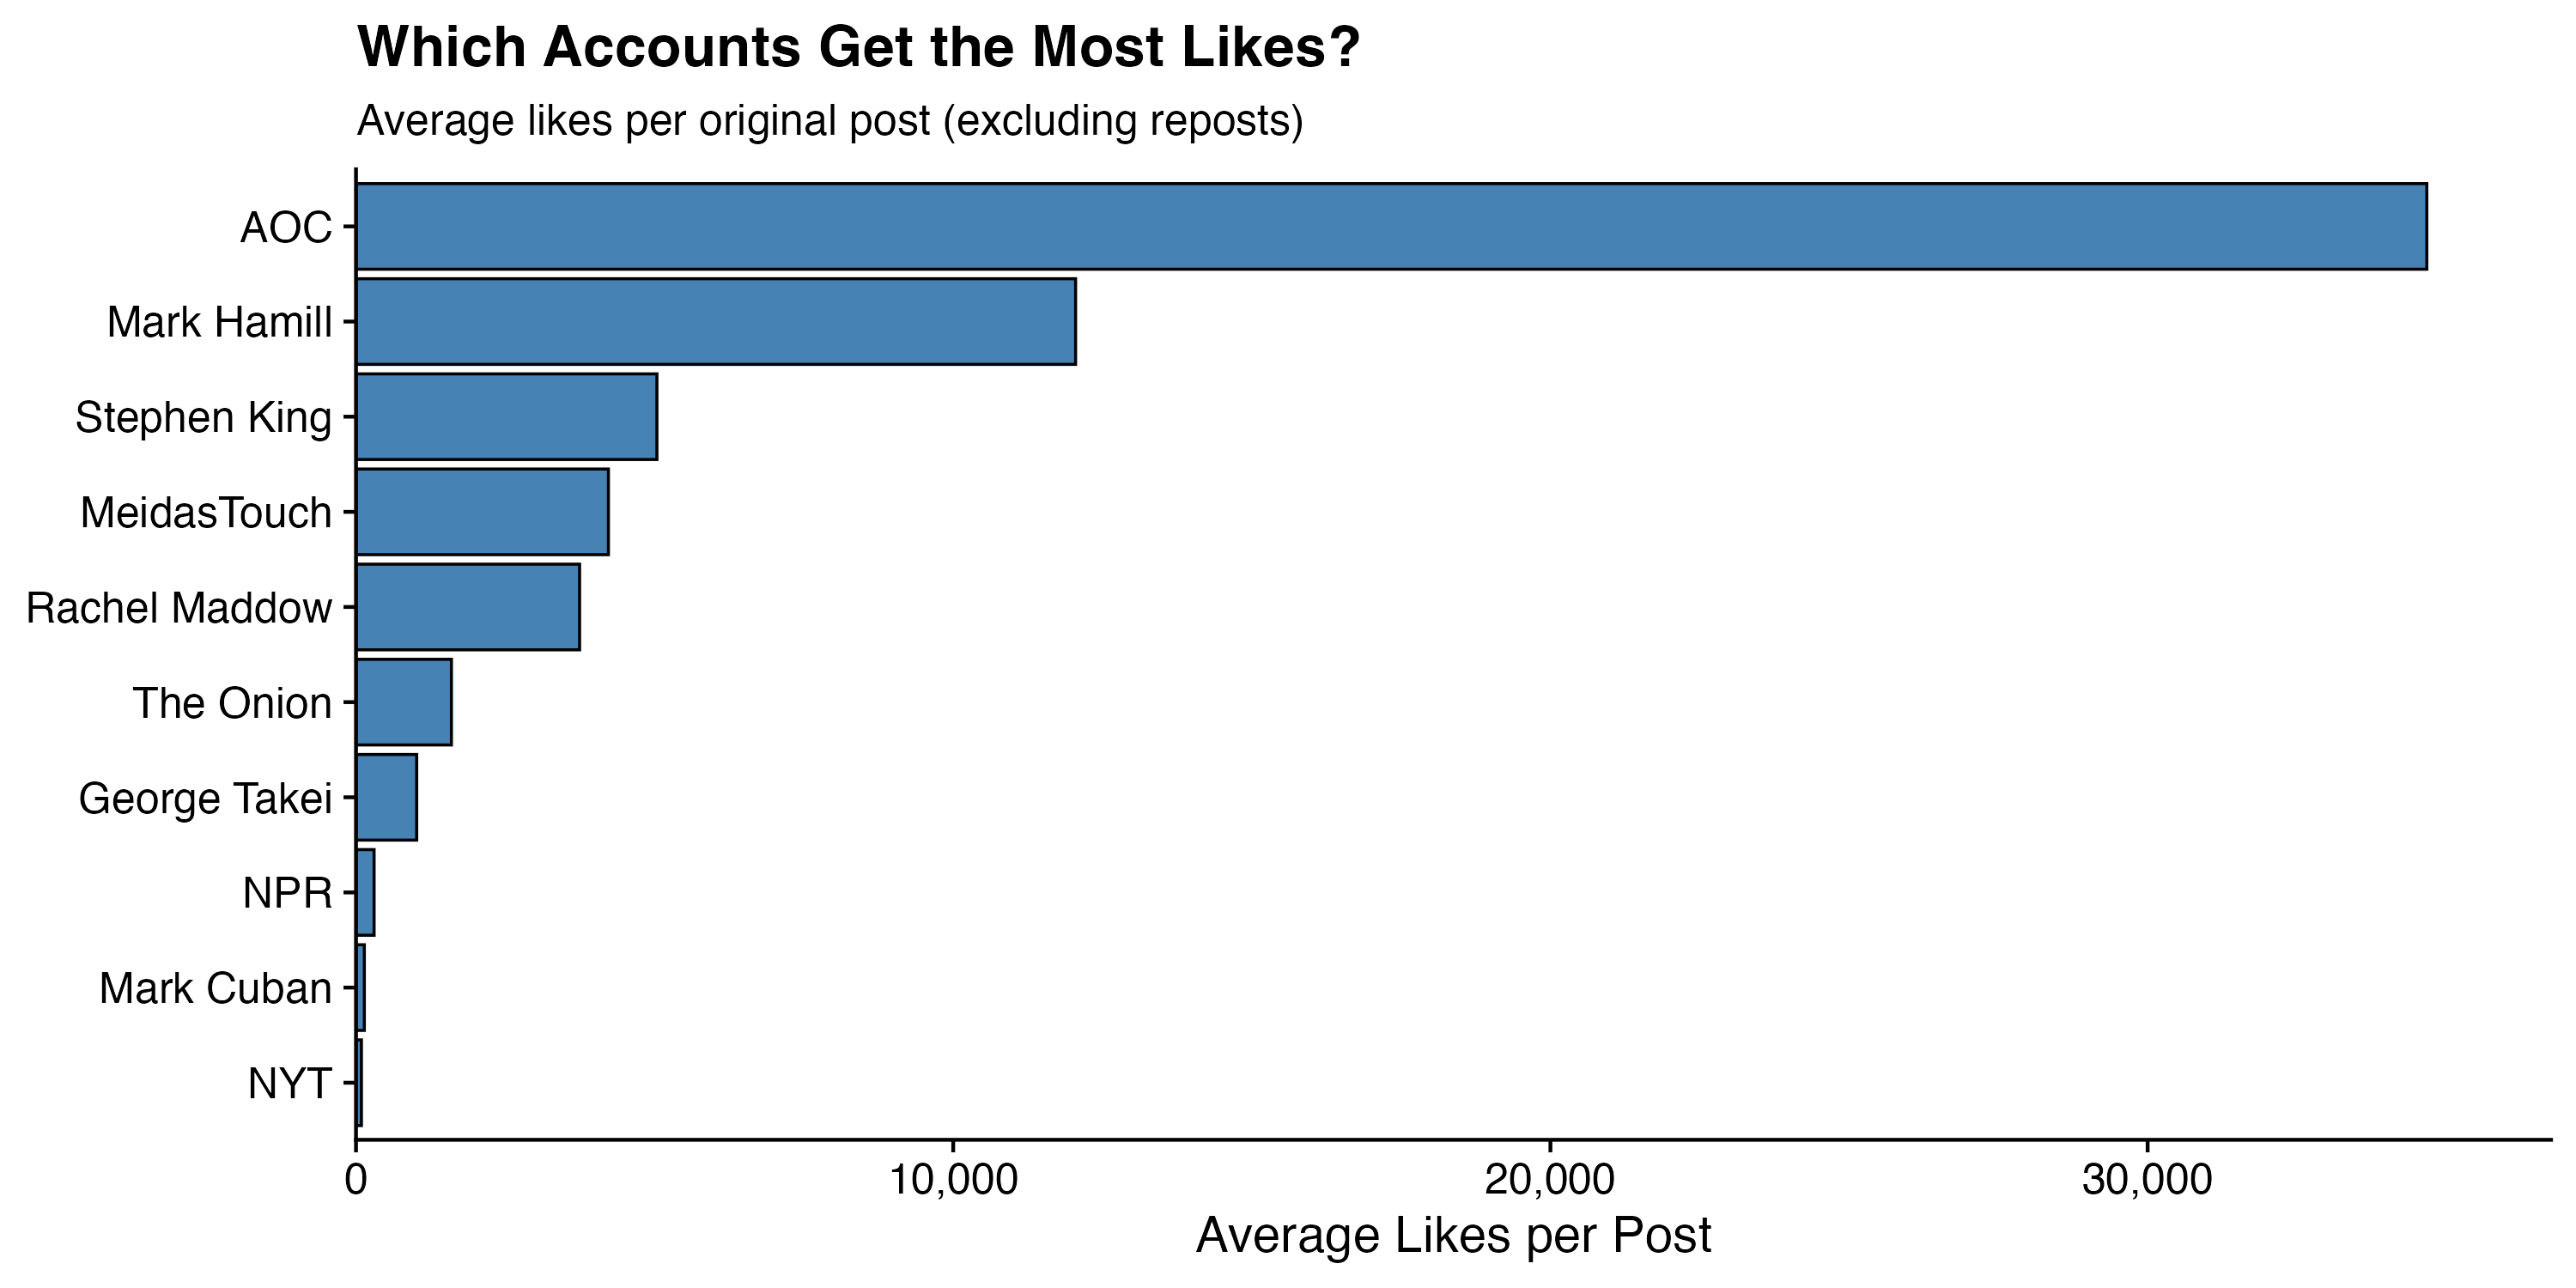
There is not a close race here. AOC averages 34,674 likes per post — more than twice the second-place Mark Hamill at 12,049. After that: Stephen King (5,039), MeidasTouch (4,226), Rachel Maddow (3,744), The Onion (1,598), George Takei (1,016), NPR (303), Mark Cuban (139), and NYT at 91.
The top 10 most-liked posts in the dataset are all AOC’s, with the most-liked reaching 167,305 likes on a post about a protest in Tucson: “Original projected attendance was 3,000 people. 23,000 showed up.”
The NPR and NYT numbers are particularly striking — both major media organizations with massive follower counts, but averaging under 300 and 100 likes per post respectively. The media organizations are generating engagement on Bluesky at a fraction of the rate of individual personalities. Whether that reflects the algorithm, audience behavior, content style, or all three is hard to disentangle from this data alone.
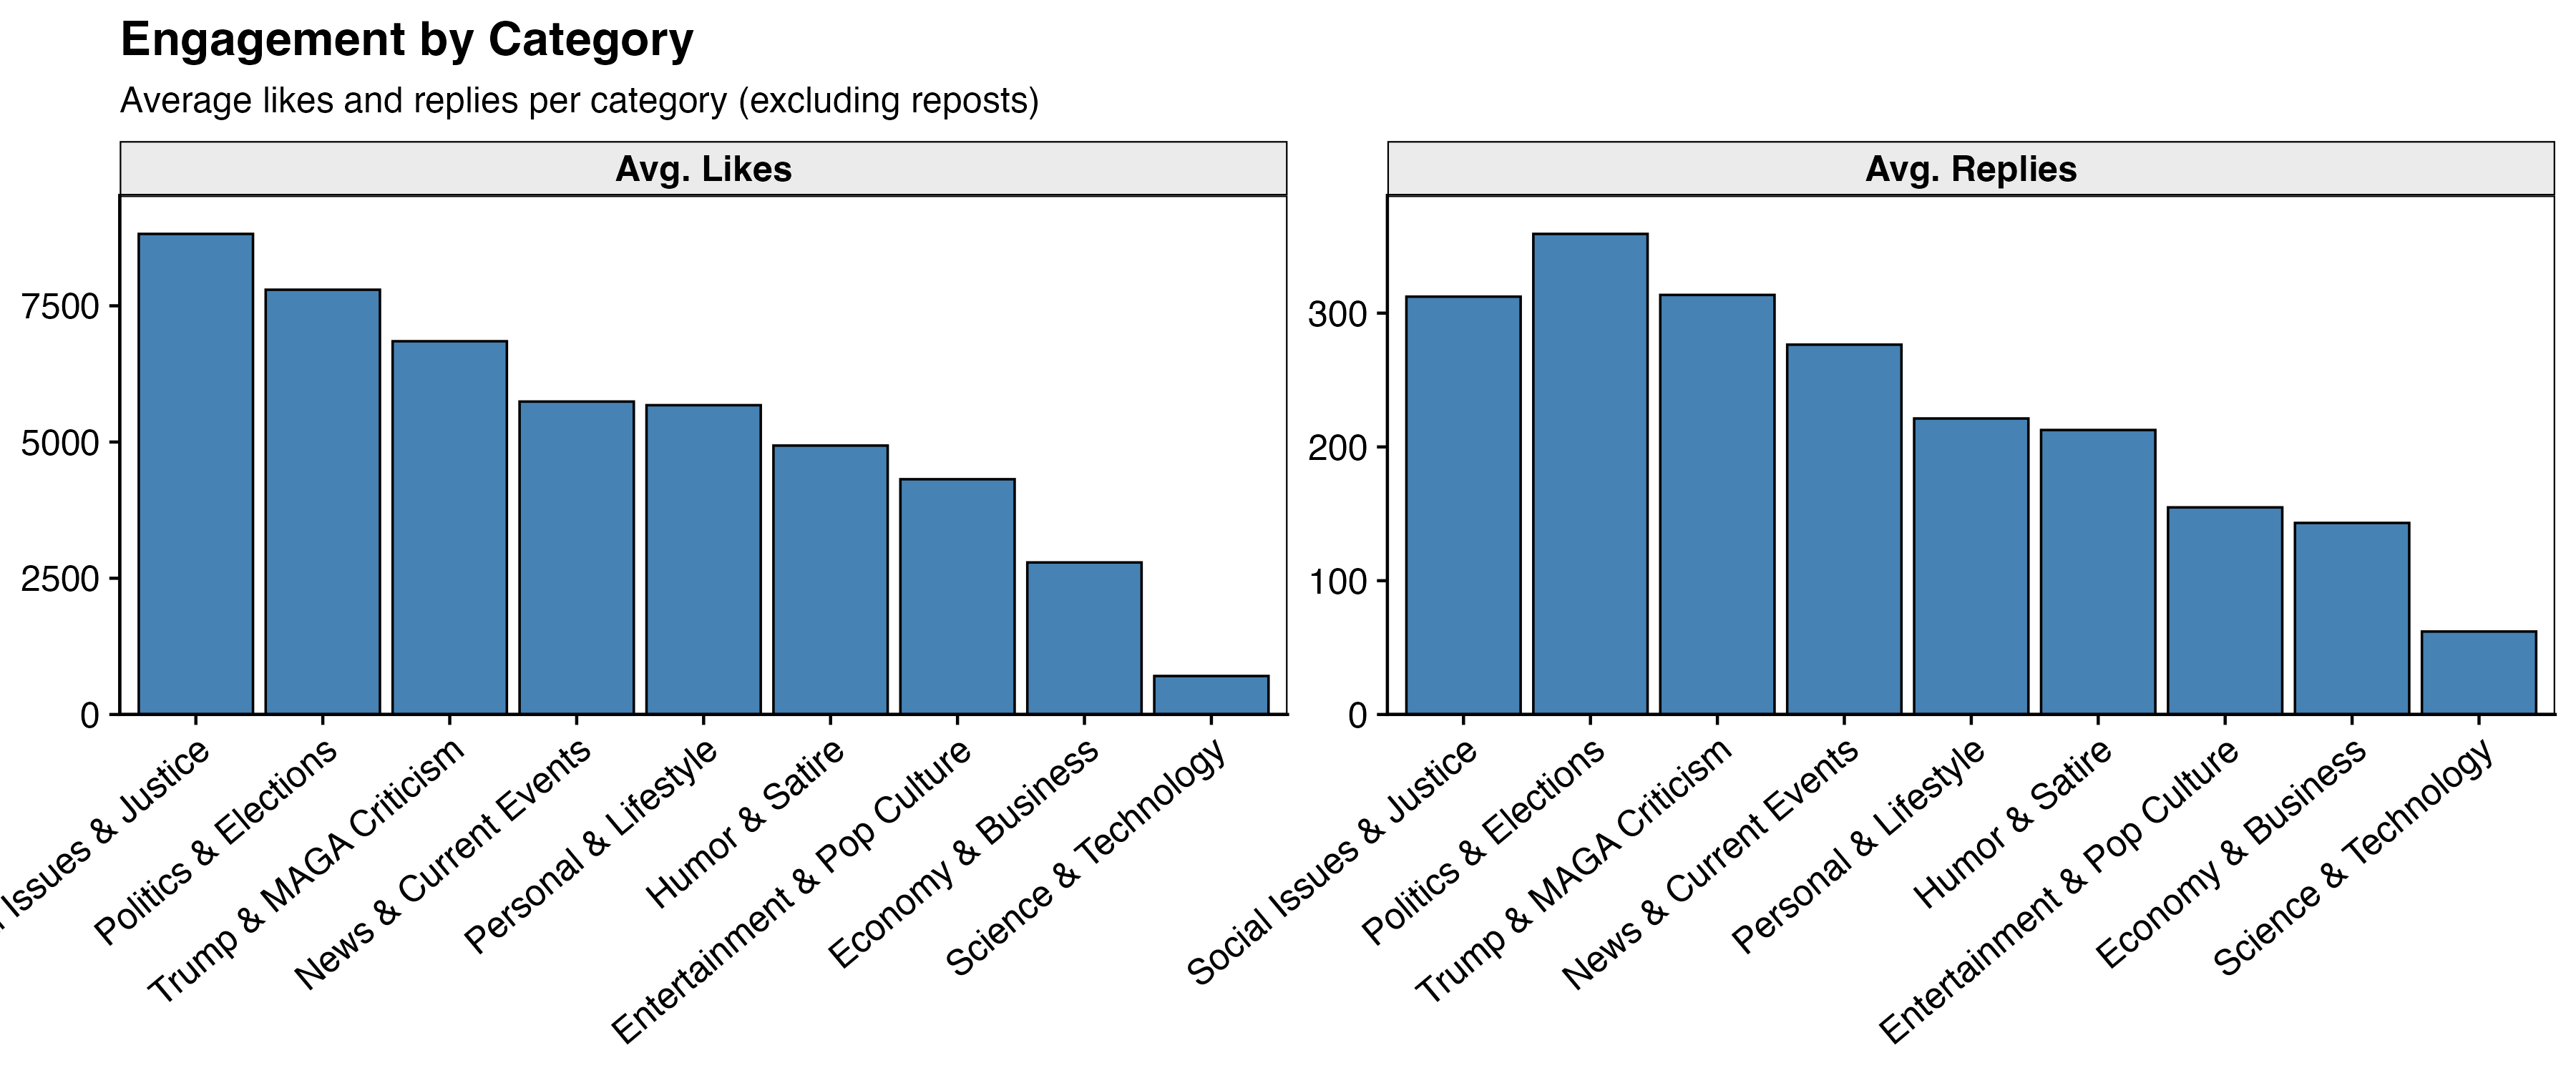
By category, the engagement hierarchy tells a clean story. Social Issues & Justice leads at 8,819 average likes per post, followed by Politics & Elections at 7,795 and Trump & MAGA Criticism at 6,849. Economy & Business posts average just 2,790 likes; Science & Technology posts average only 706 — by far the lowest of any category.
But engagement averages are heavily influenced by who posts in each category. AOC posts almost entirely in Politics and Social Issues; Mark Cuban posts almost entirely in Economy. These raw category averages are partly measuring account popularity, not content appeal in isolation.
What Predicts Likes?
To separate content from creator, I ran two regression models with log(likes + 1) as the outcome — a log transformation that handles the extreme right skew in likes (the median is 919, the max is 167,305).
The first model includes only the eight category indicators, with Personal & Lifestyle as the omitted reference category. The second adds account fixed effects, which isolates the content effect from the very large differences in per-account audience.

Before controlling for account, seven of eight categories are statistically significant predictors of likes relative to Personal & Lifestyle posts. The strongest positive predictors:
- Entertainment & Pop Culture: +1.04 log-units (the largest positive coefficient)
- Politics & Elections: +1.01
- Trump & MAGA Criticism: +0.99
- Humor & Satire: +0.77
- Social Issues & Justice: +0.60
- News & Current Events: +0.29
The two negative predictors are striking: Science & Technology (−0.47) and especially Economy & Business (−1.96) — the single largest coefficient in the model, and hugely negative. An economics post generates dramatically fewer likes than a comparable personal post in this raw model. The model explains 18.1% of the variance in log-likes.
But much of this is just reflecting AOC’s enormous engagement. AOC rarely posts about the Economy; Cuban almost exclusively does, and Cuban averages 139 likes per post. Once we account for who’s posting, the picture shifts considerably.
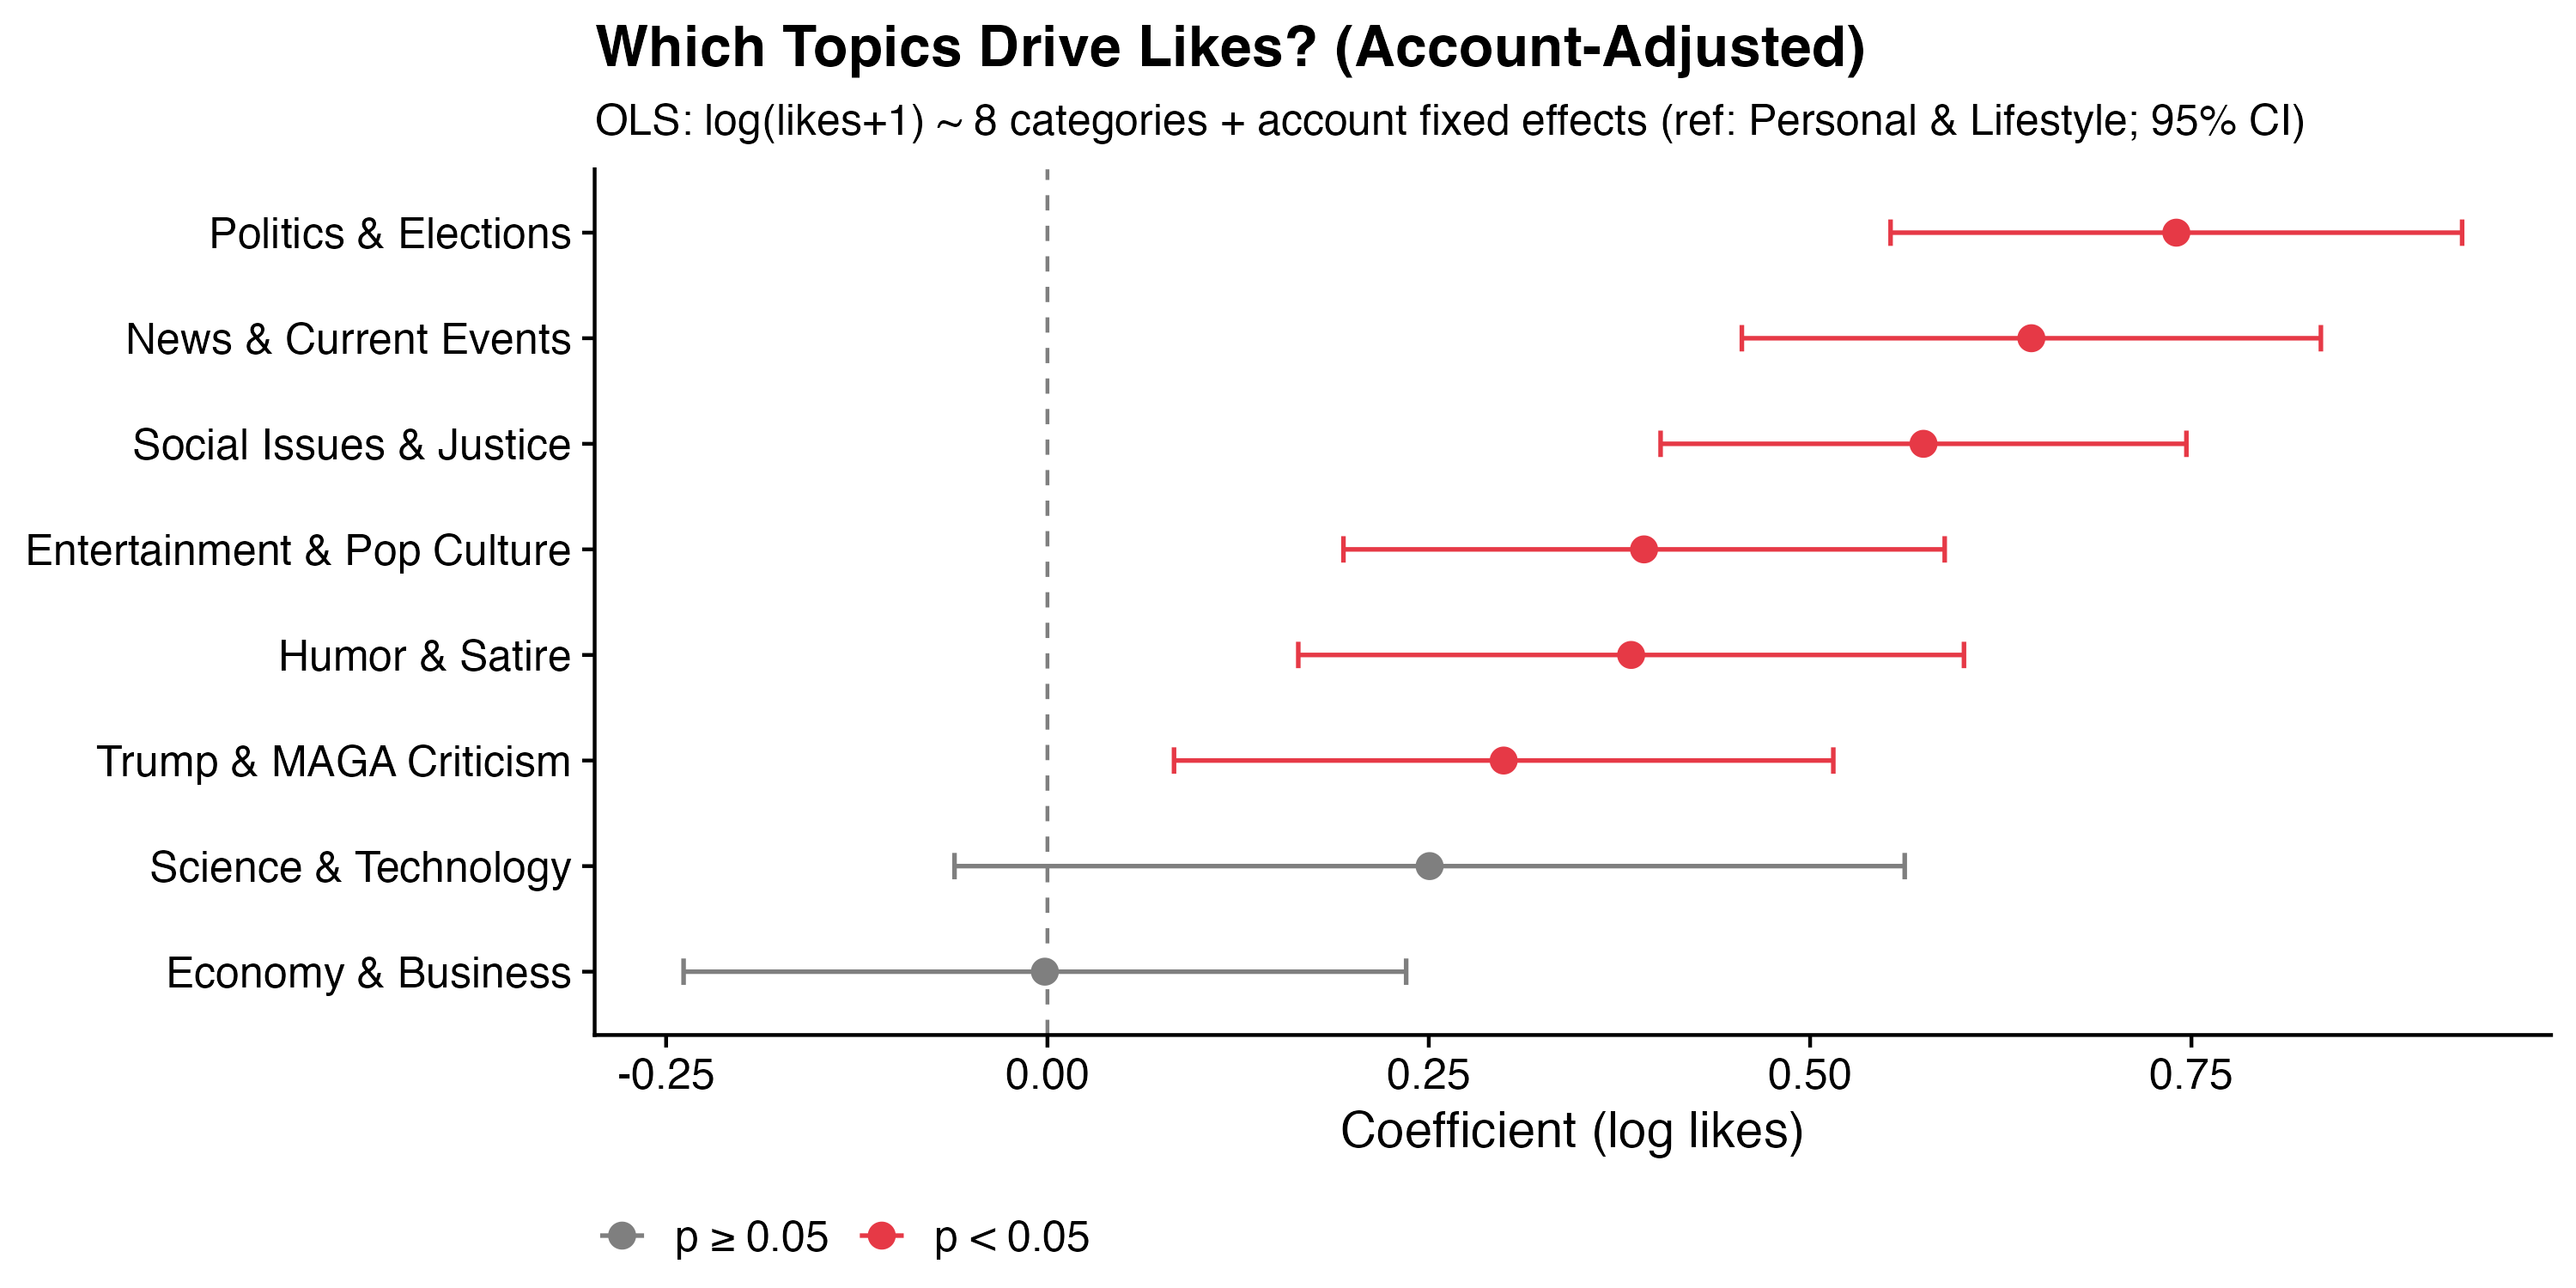
With account fixed effects added, R² jumps from 18.1% to 61.9% — the vast majority of the variance in likes is explained by who posted, not what they posted about. But the content effects don’t disappear; they just reorganize.
Politics & Elections (0.74), News & Current Events (0.65), Social Issues & Justice (0.57), Entertainment & Pop Culture (0.39), Humor & Satire (0.38), and Trump & MAGA Criticism (0.30) all remain positive and significant even after controlling for account. Within any given account, these content types generate more likes than a baseline personal post.
Most striking: Economy & Business goes from −1.96 to −0.002 (effectively zero, p = 0.99). The raw negative effect was entirely due to compositional differences between accounts — Cuban is the economy poster, and Cuban gets very few likes. Once you control for the account posting it, economics content performs no differently than personal content. The category itself isn’t the problem; the platform just happens to have its economics-focused account underperform on likes.
Science & Technology also loses its negative coefficient entirely once account is controlled (it becomes +0.25, non-significant). Science content doesn’t hurt engagement; it just happens to be posted by accounts that underperform on likes overall.
Does Timing Matter?
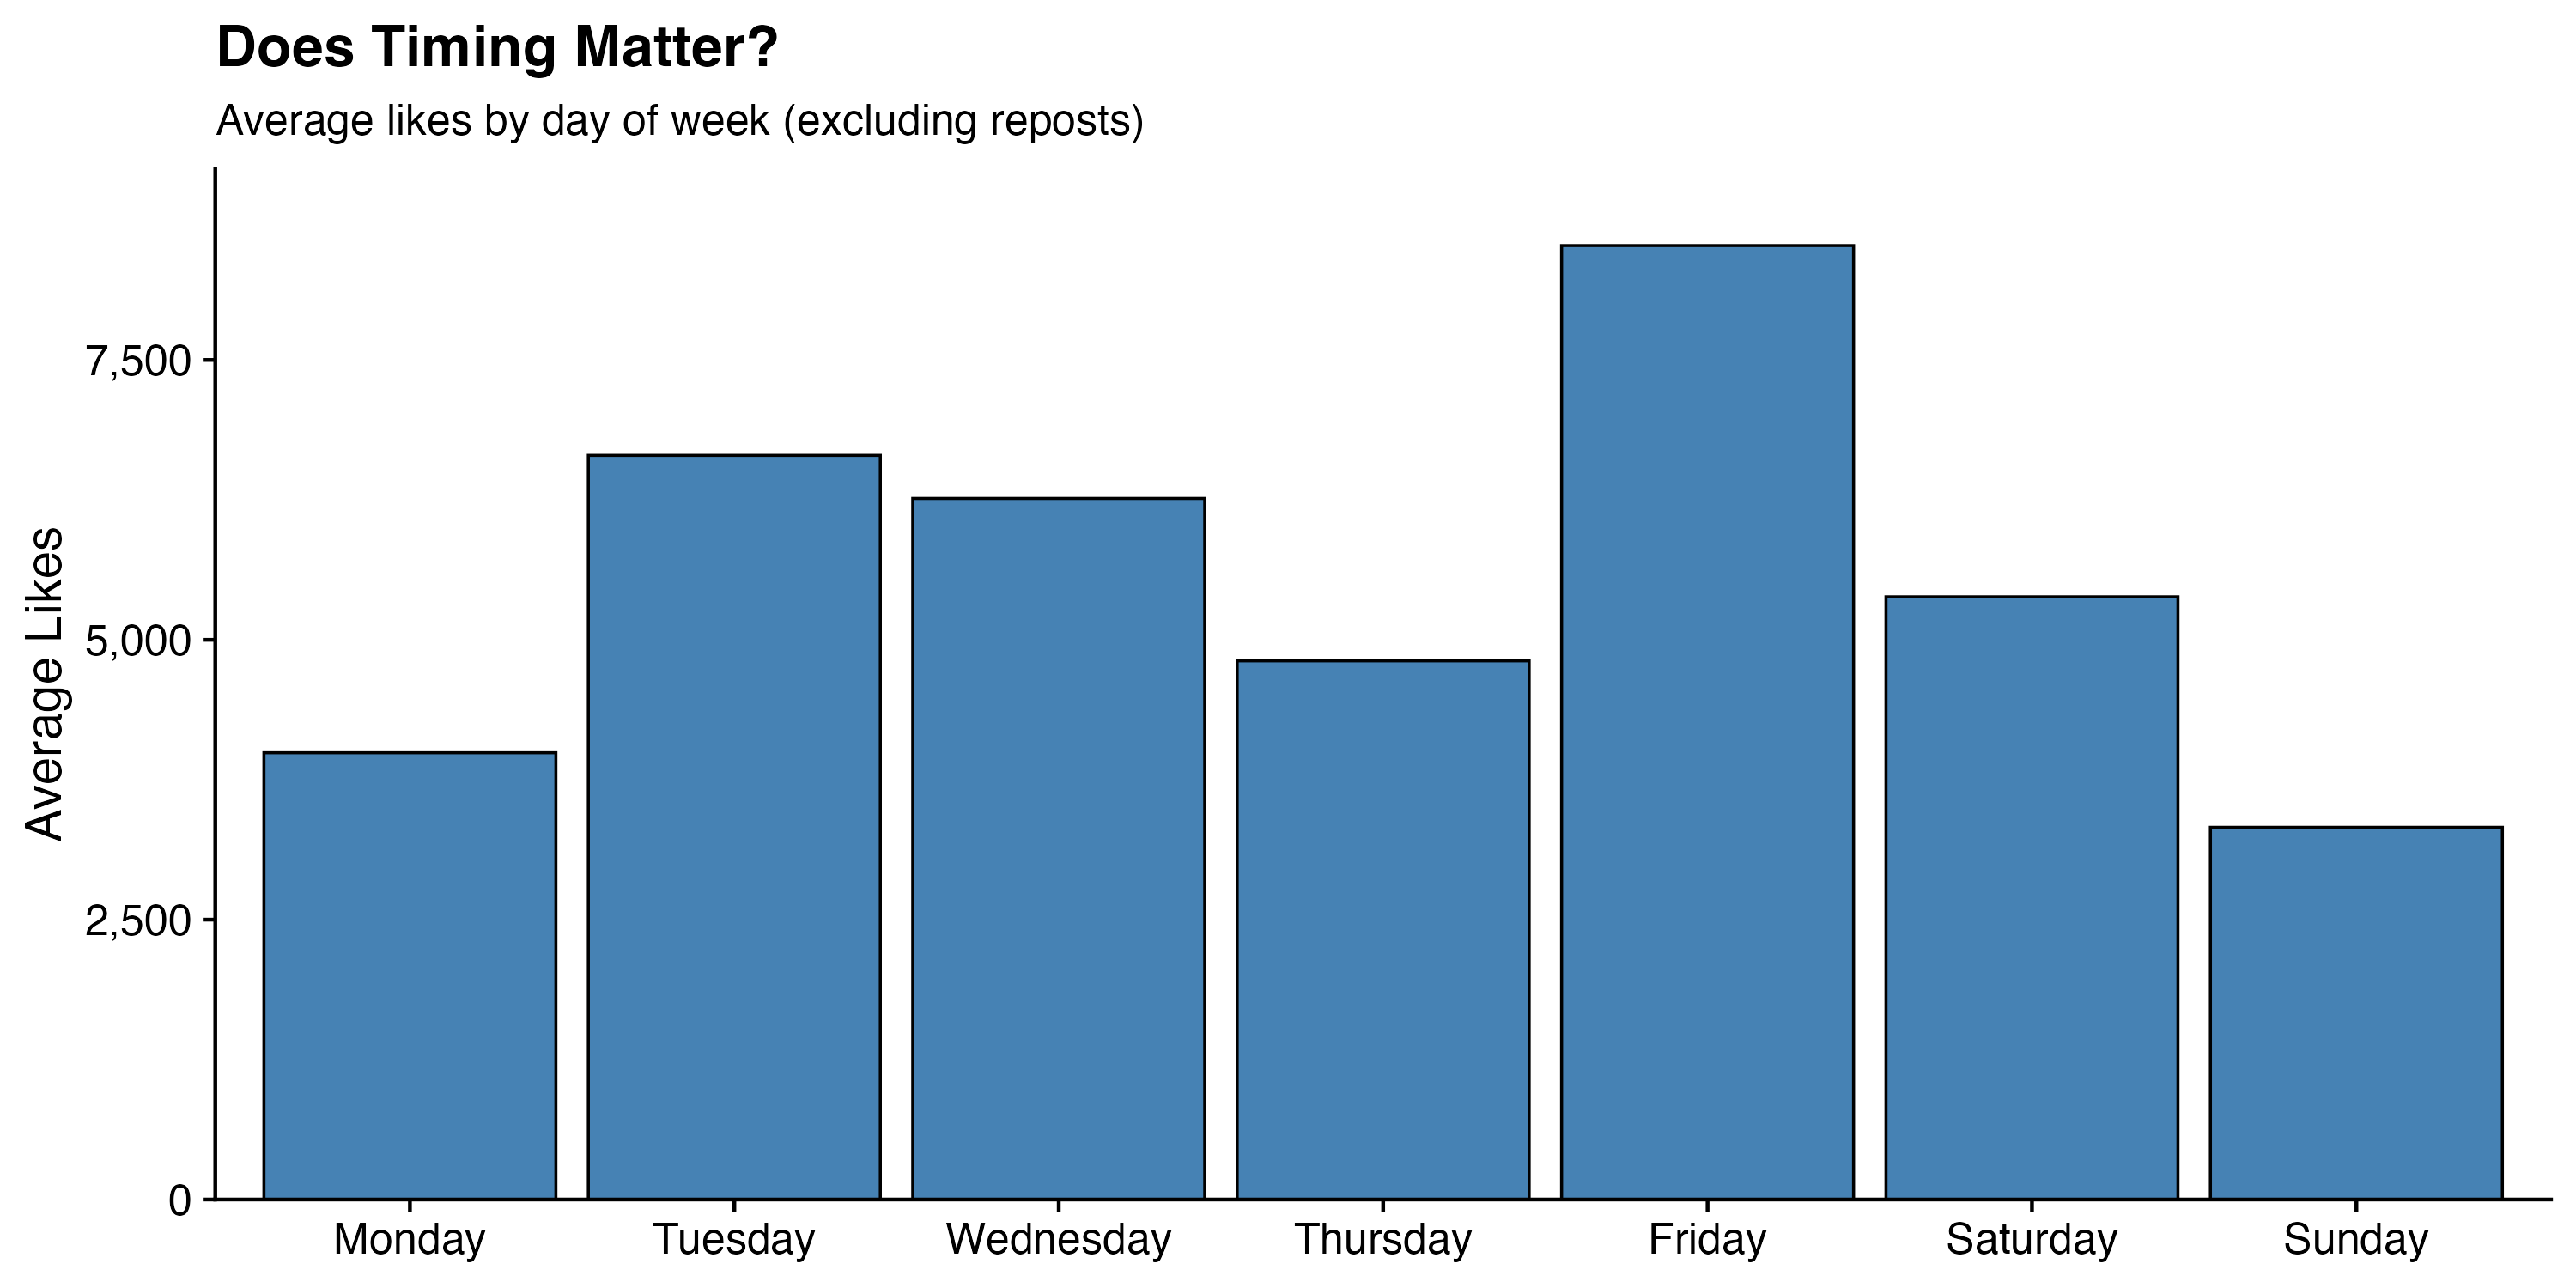
The weekly pattern is clear. Friday is the best day to post at 8,522 average likes, followed by Tuesday (6,648), Wednesday (6,263), and Saturday (5,384). Sunday is the worst day at 3,325 average likes — about 60% lower than Friday’s average.
The spread across days is meaningful but not enormous compared to the account-level differences. Moving from Sunday to Friday would roughly double your average likes in this dataset. Moving from NPR to AOC would multiply them by about 380.

The scatter plot shows every original post (log scale) colored by account. The AOC cluster sits visibly higher and to the right than every other account — more likes and more replies. The media organizations (NYT, NPR) cluster near the bottom. Most posts across all accounts sit in the low-engagement zone regardless of content type; the viral outliers are rare and concentrated in a small number of accounts.
The Public Dataset
The full classified dataset — 2,500 posts, 10 accounts, 9 binary category columns, engagement metrics — is available at chrissoria/bluesky-top10-classified on Hugging Face.
Each row is a post with columns for: account_name, account_handle, timestamp, social_media_input (the post text), likes, replies, reposts, is_repost, category_1 through category_9, and several derived fields including post_length, contains_url, and contains_image. All classification was done by GPT-4o-mini in a single-pass, no-ensemble run. For research applications requiring higher accuracy, a multi-model ensemble is straightforward to add.
A few things you could do with this dataset that I haven’t:
- Sentiment analysis by account — which accounts skew optimistic vs. cynical?
- Topic evolution over time — has the distribution shifted as the news cycle changed?
- Reply rate vs. like rate — some content generates conversation without generating likes; which category does that?
- Cross-platform comparison — the same 10 accounts presumably post on other platforms; how does Bluesky compare to X or Instagram in terms of what they share?
How to Run It Yourself
cat-vader handles the data pull and classification in a single call. Here’s the full workflow for replicating this analysis on any Bluesky account:
import catvader as cv

results = cv.classify(
    sm_source="bluesky",
    handle="aoc.bsky.social",   # any Bluesky handle
    sm_posts=250,                # number of recent posts to fetch
    categories=[
        "Politics & Elections",
        "Trump & MAGA Criticism",
        "Social Issues & Justice",
        "News & Current Events",
        "Entertainment & Pop Culture",
        "Humor & Satire",
        "Science & Technology",
        "Economy & Business",
        "Personal & Lifestyle",
    ],
    description="Social media posts from a public Bluesky account",
    api_key="your-openai-api-key",
    user_model="gpt-4o-mini",
)

results.to_csv("bluesky_classified.csv", index=False)
The output is a DataFrame with one row per post and binary columns for each category. From there, any standard analysis pipeline applies — R, Python, whatever you prefer.
One difference from the Threads workflow: Bluesky doesn’t require OAuth or a developer account. The public API is unauthenticated for reading public posts. You just need an OpenAI (or other provider) key for the classification step.
The consistent finding across both the Threads analysis and this one is that who is posting matters far more than what they post. Account identity — follower count, posting frequency, platform reputation — explains more of the variance in engagement than any content category. But content is not irrelevant: within any given account, political and social posts consistently outperform baseline personal posts, and that effect survives account controls.
For Bluesky specifically, the platform’s current character as a haven for politically engaged progressives shows up plainly in the data. Even The Onion — a satirical outlet that theoretically covers everything — lands 81% of its posts in Humor & Satire while still earning engagement that tracks the political intensity of the moment. The platform has a distinct topical gravity, and the accounts doing best are the ones whose content aligns with it.
If you build something interesting with the dataset or the cat-vader pipeline, reach out at chrissoria@berkeley.edu.