
Analyzing My Threads Feed with cat-vader: LLM-Powered Social Media Classification at Scale
Published:

I spend a lot of time on Threads. Over the past two and a half years I’ve posted nearly 900 times: opinions on politics, technology, research, culture, and whatever else caught my attention that day. But I’ve never sat down and actually looked at what I post about. What are my real preoccupations? What topics dominate my feed? Which posts actually get engagement?
This post is an attempt to answer those questions systematically, using an LLM-powered classification pipeline I built called cat-vader — a fork of my open-source survey classification package, cat-llm, adapted for social media data.
Background: cat-llm and cat-vader
cat-llm is an open-source Python package I originally built for classifying open-ended survey responses at scale. You give it a list of text responses and a set of categories, and it uses large language models to assign each response to one or more categories, with support for multi-model ensembles, chain-of-thought reasoning, and automatic category discovery. It was designed for researchers who need to code thousands of survey responses without manually reading each one.
The core architecture turned out to be highly resilient to different kinds of text input. Survey responses and social media posts are structurally similar — short, opinionated, often ambiguous text that needs to be bucketed into meaningful categories. So I cloned cat-llm into cat-vader, stripped out the survey-specific scaffolding, and built a pipeline that can classify any collection of social media posts — whether you’re working from a scraped dataset, a platform export, or a direct API pull. For convenience, cat-vader also wires directly to the Threads API to pull your personal post history with engagement metrics in one call.
The goal of this post is to walk through that pipeline end-to-end using my own Threads feed as the example dataset, and then use the results to take an honest look at what I’ve been posting about. The same workflow applies to any corpus of social media text.
What Do I Actually Post About?
Before classifying anything, I needed to decide what categories to use. I could have imposed them from the top down — just picked eight topics that felt right — but that risks missing something real in my data, or imposing categories that don’t actually fit how I write. Instead, I used cat-vader’s explore() function to let the data suggest its own themes first.
explore() works by repeatedly sampling random chunks of posts, asking the LLM to extract the most common topics from each chunk, and collecting all the extracted labels across many passes. It doesn’t merge or deduplicate — it returns every raw label string from every chunk across every iteration. The idea is that categories which appear frequently and consistently are the ones that genuinely characterize the corpus, while one-off labels are noise.
import catvader as cv
import pandas as pd

df = pd.read_csv("threads_year.csv")
texts = df[df["text"].str.len() > 0]["text"].tolist()  # 582 posts with text

raw = cv.explore(
    input_data=texts,
    api_key="your-openai-api-key",
    description="Social media posts about current events, politics, technology, culture, and personal opinions",
    user_model="gpt-4o",
    iterations=6,
    divisions=15,
    max_categories=8,
    categories_per_chunk=8,
)
This produced 720 raw category extractions across 6 iterations and 15 chunk divisions, yielding 229 unique label strings. I counted the frequency of each label and eyeballed the top results to identify which themes were genuinely dominant versus which were just slightly different phrasings of the same idea (e.g. “Economy”, “Economics”, “Economy and Business”, and “Economy and Finance” are all the same theme).
Here are the top categories by raw frequency:
| Category | Times Found |
|---|---|
| Politics | 58 |
| Technology | 52 |
| Social Issues | 39 |
| Personal Opinions | 27 |
| Technology and AI | 22 |
| Economics | 16 |
| Education | 16 |
| Health and Science | 16 |
| Culture | 16 |
| Economy | 13 |
| Personal Experiences | 12 |
| Culture and Society | 12 |
| Media and Communication | 10 |
| Personal Opinions and Experiences | 10 |
| Media and Entertainment | 9 |
| Economy and Business | 9 |
| Education and Academia | 9 |
| Science and Health | 9 |
The signal is clear. Collapsing the variants down, eight themes dominate: Politics, Technology & AI, Social Issues, Economics & Finance, Health & Science, Education & Research, Culture & Entertainment, and Personal. These became the starting point for the final category set.
Defining My Categories
Rather than using bare labels, I defined each category with a description and concrete examples. This follows best-practice category construction from my own empirical work on LLM classification: verbose categories with descriptions and examples significantly outperform bare labels, improving accuracy by reducing model ambiguity on borderline cases.
The explore() output pointed to the broad themes, but the final set draws heavily on my own domain knowledge of what I post about. I know I post a lot about politics, and I know that my political posts tend to fall into distinct registers — partisan frustration, specific policy arguments, and direct Trump commentary — that a generic “Politics” label would collapse together. I also know I post disproportionately about AI relative to most people, which warranted its own category rather than being folded into Technology. My final categories reflect both what my data showed and what I know about myself as a poster.
1. Partisan Politics — Posts relating to partisanship directly or indirectly: references to political parties, political tribalism, electoral dynamics, or the behavior of politicians and political actors as representatives of a party or ideological bloc (e.g., “The Republican Party has moved too far right,” “Democrats keep losing working-class voters”).
“Either side of the political spectrum has little empathy for the other. They actively dislike each other. When an act of violence occurs, the first instinct is to ask which side did it.”
2. Policy Politics — Posts advocating for or critiquing specific policies or policy positions, independent of partisan framing: arguments about what government should or shouldn’t do, regulatory stances, or calls for systemic reform (e.g., “We need universal healthcare,” “Tech companies need stronger antitrust enforcement”).
“It should be illegal to create AI videos meant to mislead and misinform people about current events.”
3. Anti-Trump — Posts directly critiquing Donald Trump, his character, his decisions in office, his policies, or individuals and groups who support him or his agenda (e.g., “Trump’s tariffs are going to tank the economy,” “MAGA voters keep getting lied to”).
“Trump is doing a great job at driving global unity… in their opposition to the US as an international bully.”
4. Technology — Posts discussing technology in any form, broadly construed: software, hardware, consumer devices, platforms, the tech industry, or the societal implications of technological change (e.g., “Apple’s new chip is a generational leap,” “Social media is rewiring how we form opinions”).
“Anthropic is all the hype but OpenAI still has the best models sorry to say.”
5. Artificial Intelligence — Posts specifically about AI models, AI capabilities, or commentary on AI companies such as OpenAI, Anthropic, Google DeepMind, or xAI. This includes takes on specific models (GPT, Claude, Gemini, Grok), opinions on what AI can and cannot do, or the direction of the AI industry (e.g., “The AI hype cycle is showing cracks,” “LLMs are great at pattern matching but terrible at actual reasoning”).
“In my opinion, the only people who are saying LLMs will someday automate all jobs don’t really understand the technology.”
6. Social Issues — Posts about social conditions, inequality, discrimination, or systemic patterns in society, without explicitly advocating for a specific policy response or criticizing political leadership. The focus is observational or normative about society itself rather than prescriptive about what government should do (e.g., “The wealth gap between generations is unlike anything we’ve seen,” “Racism in hiring is still very much alive”).
“The most deflating thing about this whole thing is how two people will view the same video and come to entirely different conclusions.”
7. Shit Posting — Low-effort, irreverent, or deliberately provocative posts with no pretense of serious commentary. The tone is casual to the point of flippant, the take is blunt, and the goal is more to express a vibe than make an argument (e.g., “Astrology is BS,” “Nobody actually likes networking events”).
“Daily reminder that astrology is still BS.”
8. Economics & Finance — Posts relating to economic conditions, financial markets, or specific market developments: references to stock prices, commodity prices, oil markets, interest rates, inflation, or broader signals about the state of the economy (e.g., “The stock market is pricing in a recession,” “Coffee prices are up 40% and nobody is talking about it”).
“The Strait of Hormuz, which handles roughly 20% of the world’s daily oil supply, is effectively shut down. That means lower supply, which means higher prices. When oil prices rise the price of all other commodities rise.”
9. Thirst Trap — Posts that are flirty, self-promotional, or designed to attract attention and engagement through charm or physical appeal (e.g., “Just got a haircut and feeling myself,” “Anyone else look good today or just me?”).
My Category Breakdown
With my categories defined, I ran classify() on the full year of text posts — 582 posts with non-empty text content — using Llama 3.3 70B on SambaNova. Each post was classified against all categories independently, meaning a single post can and often does belong to more than one category. A post lamenting Trump’s tariff policy, for example, might be tagged as both Anti-Trump and Economics & Finance. That’s by design: my categories aren’t mutually exclusive buckets, they’re lenses.
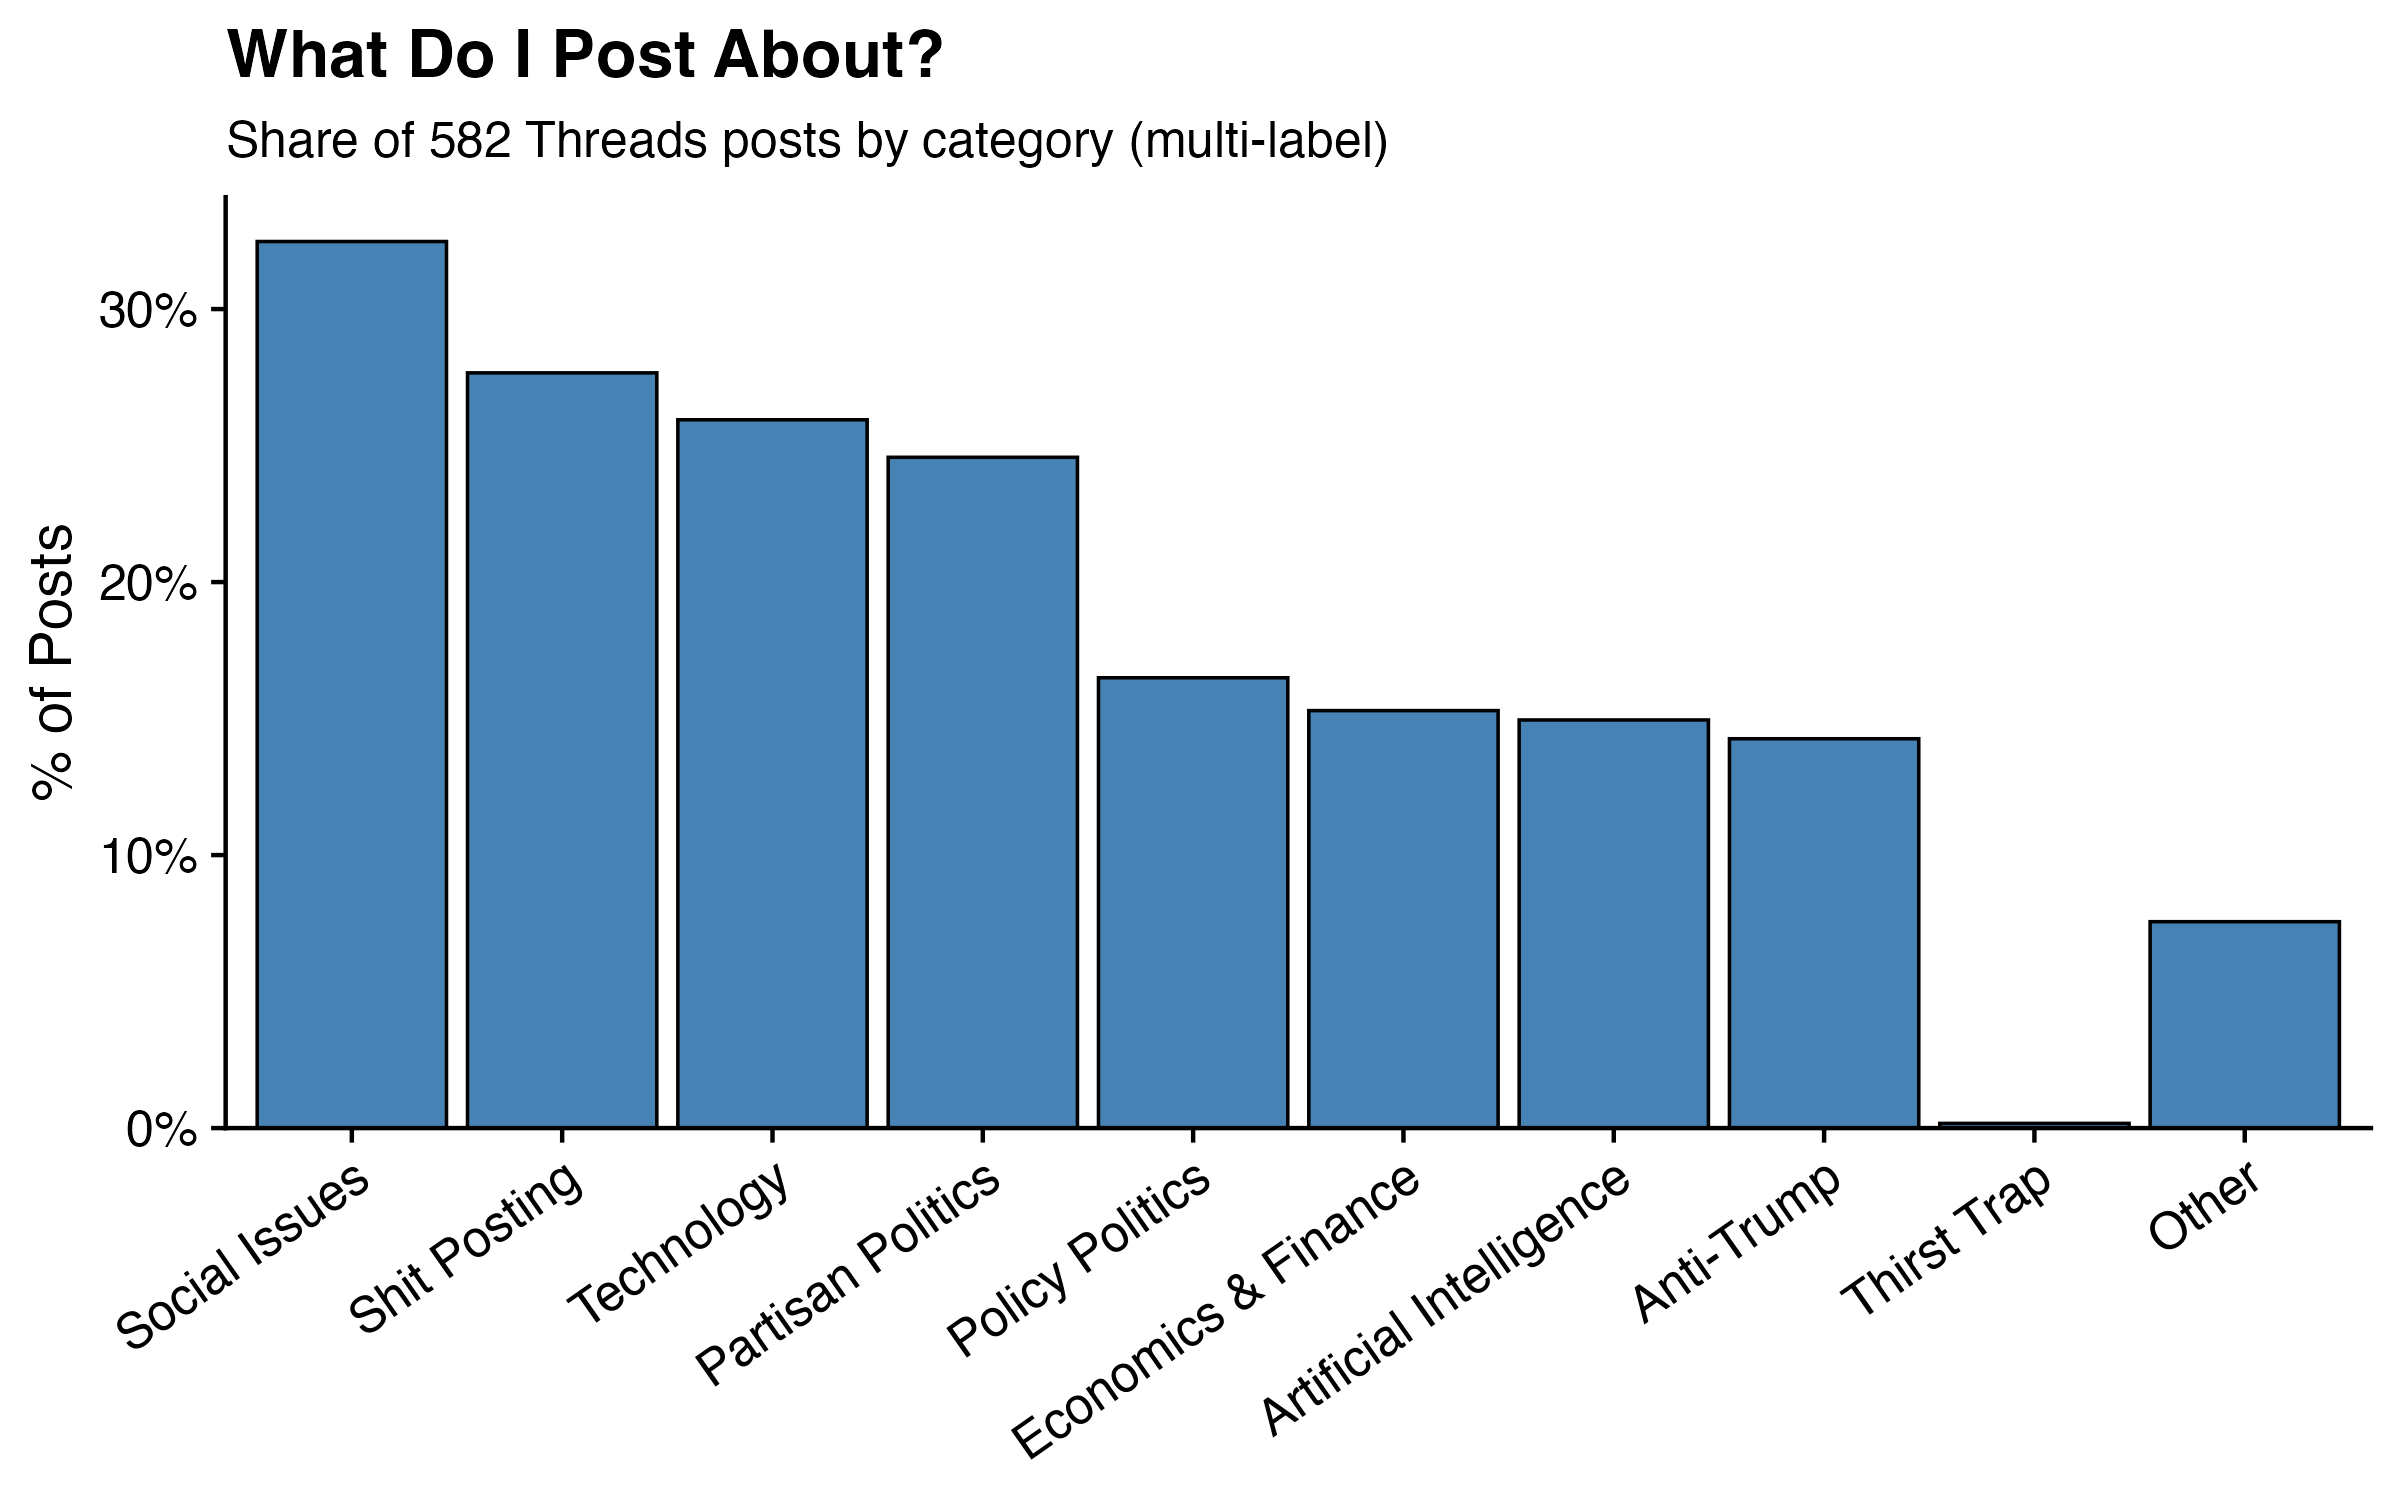
The chart below shows the percentage of posts that were assigned to each category. Because categories overlap, the bars don’t sum to 100% — they can’t. What the chart is really showing is the frequency of each topic in my feed: how often, across 582 posts, did I reach for a given subject. Think of it less as a pie chart and more as a set of independent thermometers, each measuring how much of my posting energy went toward a given theme.
A note on scope: cat-vader can classify images directly, but for this analysis I focused on text only. My dataset includes image posts, but the model was given just the text caption — no image content. Posts without any text were excluded entirely, and image posts were classified solely on whatever caption was attached. That’s a real limitation, and one worth keeping in mind when interpreting any categories that might skew visual (more on that in a moment).
I’ll be honest: I wasn’t sure what I’d find. I post somewhat mindlessly — something catches my eye, I have a reaction, I type it out. I don’t sit down with a content strategy. So this is genuinely an exercise in holding up a mirror.
One early finding did give me pause: Shit Posting came in second overall at 27.7% of posts, just behind Social Issues at 32.5% and ahead of Technology at 25.9%. My first instinct was that something had gone wrong — a miscategorized label, a prompt that was too loose, something. I went back and spot-checked the flagged posts. Nope. Fully accurate. Apparently more than a quarter of what I put out into the world is, by any reasonable definition, a shit post. I have made peace with this, though I’ve also quietly vowed to post with a bit more intention going forward, with the goal of demoting Shit Posting from a top-three category to something more like fifth. For what it’s worth, my top four — Social Issues (32.5%), Shit Posting (27.7%), Technology (25.9%), and Partisan Politics (24.6%) — probably tells you everything you need to know about me as a person.
One other result worth flagging: Thirst Trap came in at exactly one post (0.2%). False positives happen, and this is a good example of why. The post in question was an image captioned simply “Me”, and since the model only had that single word to work with, tagging it as a thirst trap is a defensible inference. Whether it actually was one depends on the photo, which the model never saw. I’m not saying it wasn’t.
Engagement by Category
One of the advantages of pulling data directly through the Threads API is that cat-vader returns not just post text but a full set of engagement metrics alongside it. For every post, the package outputs:
| Column | Description |
|---|---|
timestamp | Date and time of the post |
media_type | Post type (text, image, video, repost) |
text | Post text content |
image_url | URL of attached image, if any |
likes | Number of likes |
replies | Number of replies/comments |
reposts | Number of reposts |
quotes | Number of quote posts |
views | Total post impressions |
shares | Number of shares |
clicks | Number of link clicks |
That means the classified dataset isn’t just a topic-coded text corpus — it’s a topic-coded text corpus with performance data attached. Which opens up an obvious question: does what I post about actually affect how much engagement I get?
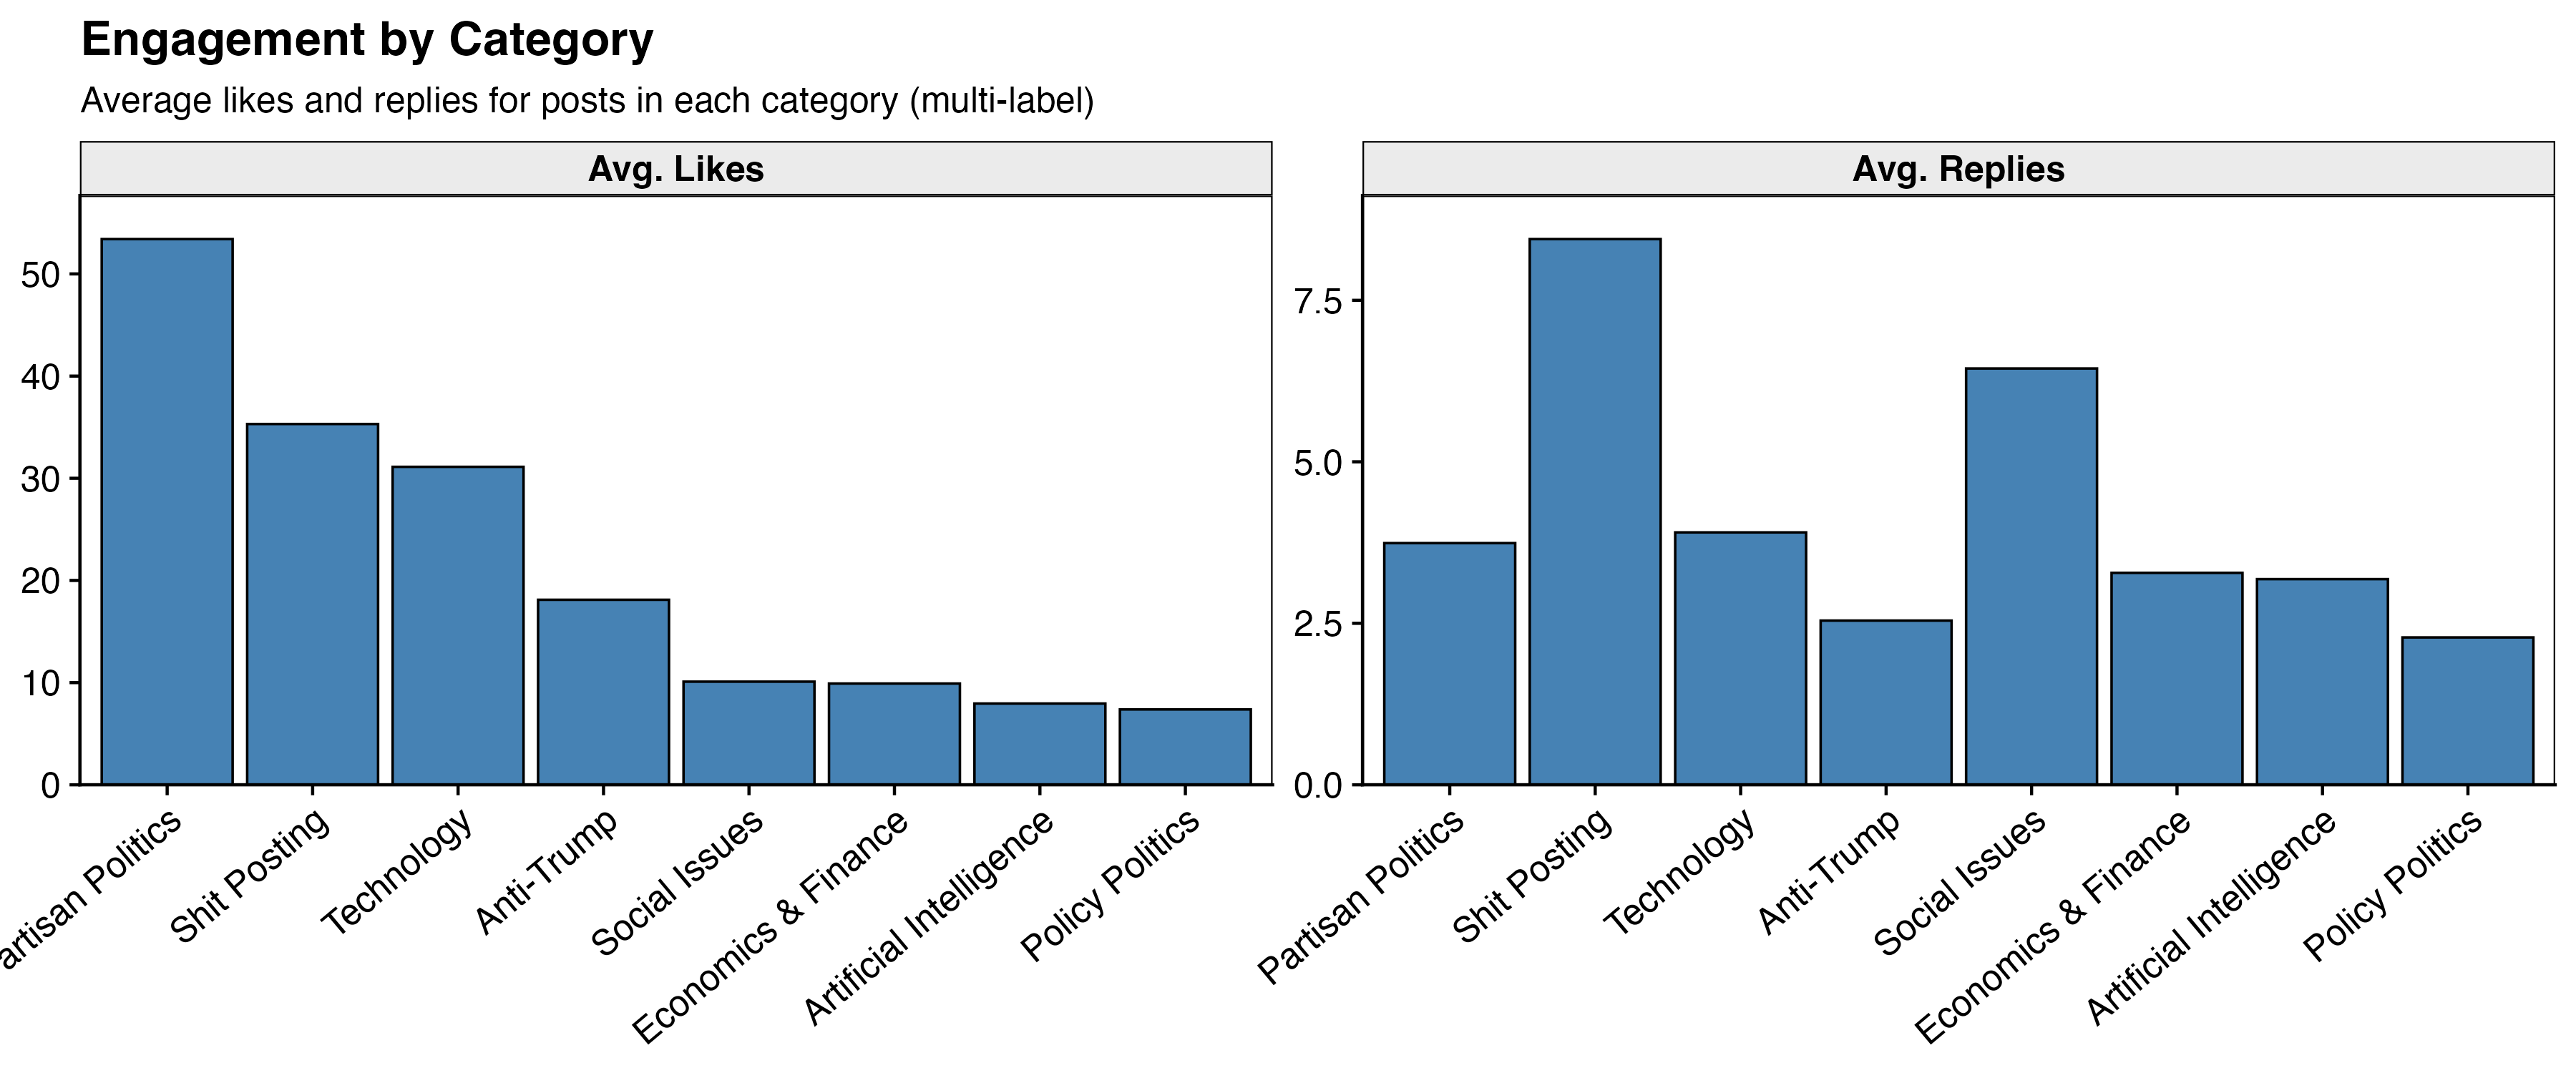
The chart below shows average likes and average replies broken out by category. Because posts can belong to multiple categories, the same post may appear in more than one bar. The x-axis is sorted by average likes descending.
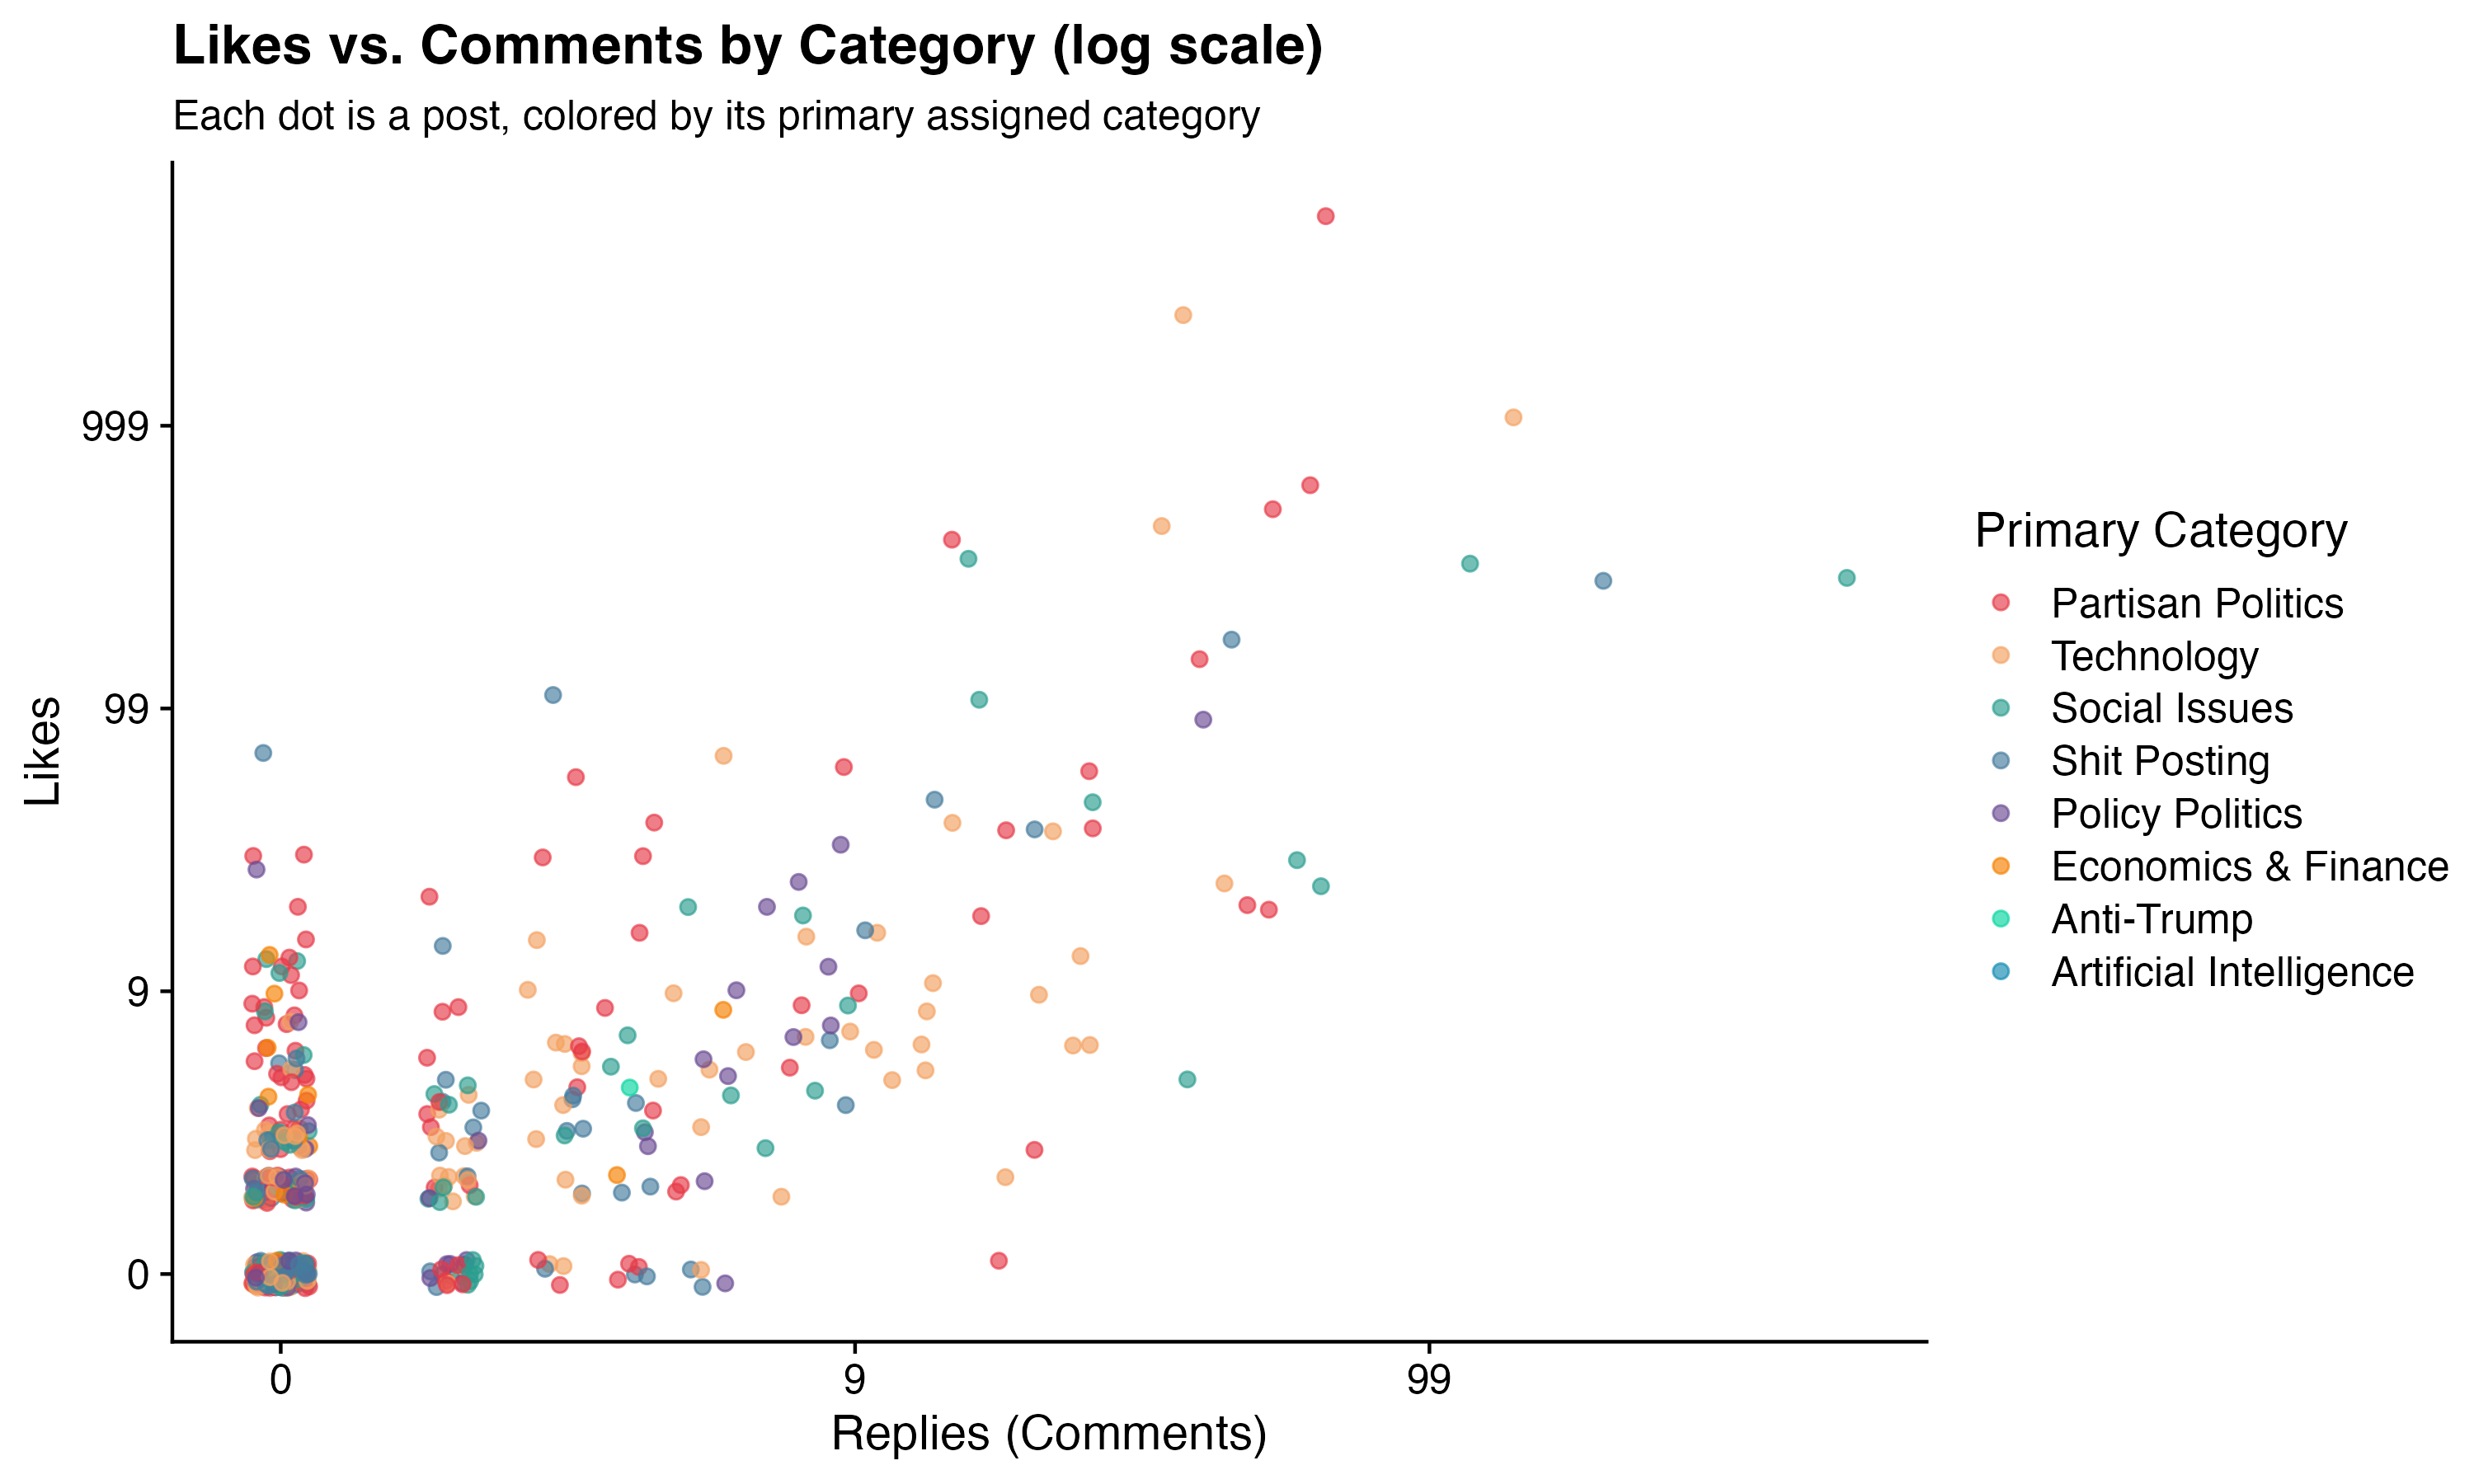
To see the full picture, the scatter plot below shows every post individually — x-axis is replies, y-axis is likes, log scale on both axes, colored by primary category. The log scale is doing a lot of work here. Without it, the chart is basically one dot in the top-right corner and 580 dots stacked on top of each other at zero. With it, you can actually see my distribution — which, in all honesty, is mostly a dense cloud of dots in the bottom-left. The majority of what I post sinks quietly into the void, liked by a handful of people who were probably just scrolling past and hit the button by accident. A few posts escape. Most do not. This is the reality of posting.
What Actually Predicts Views?
The bar charts above are descriptive — they show averages, but averages don’t control for anything. A category might look high-performing simply because I happen to post it more, or because it correlates with another category that’s doing the real work. To get a cleaner picture, I ran models that hold all categories constant simultaneously, isolating the independent effect of each one. I ran a separate model for each outcome — views, likes, and replies.
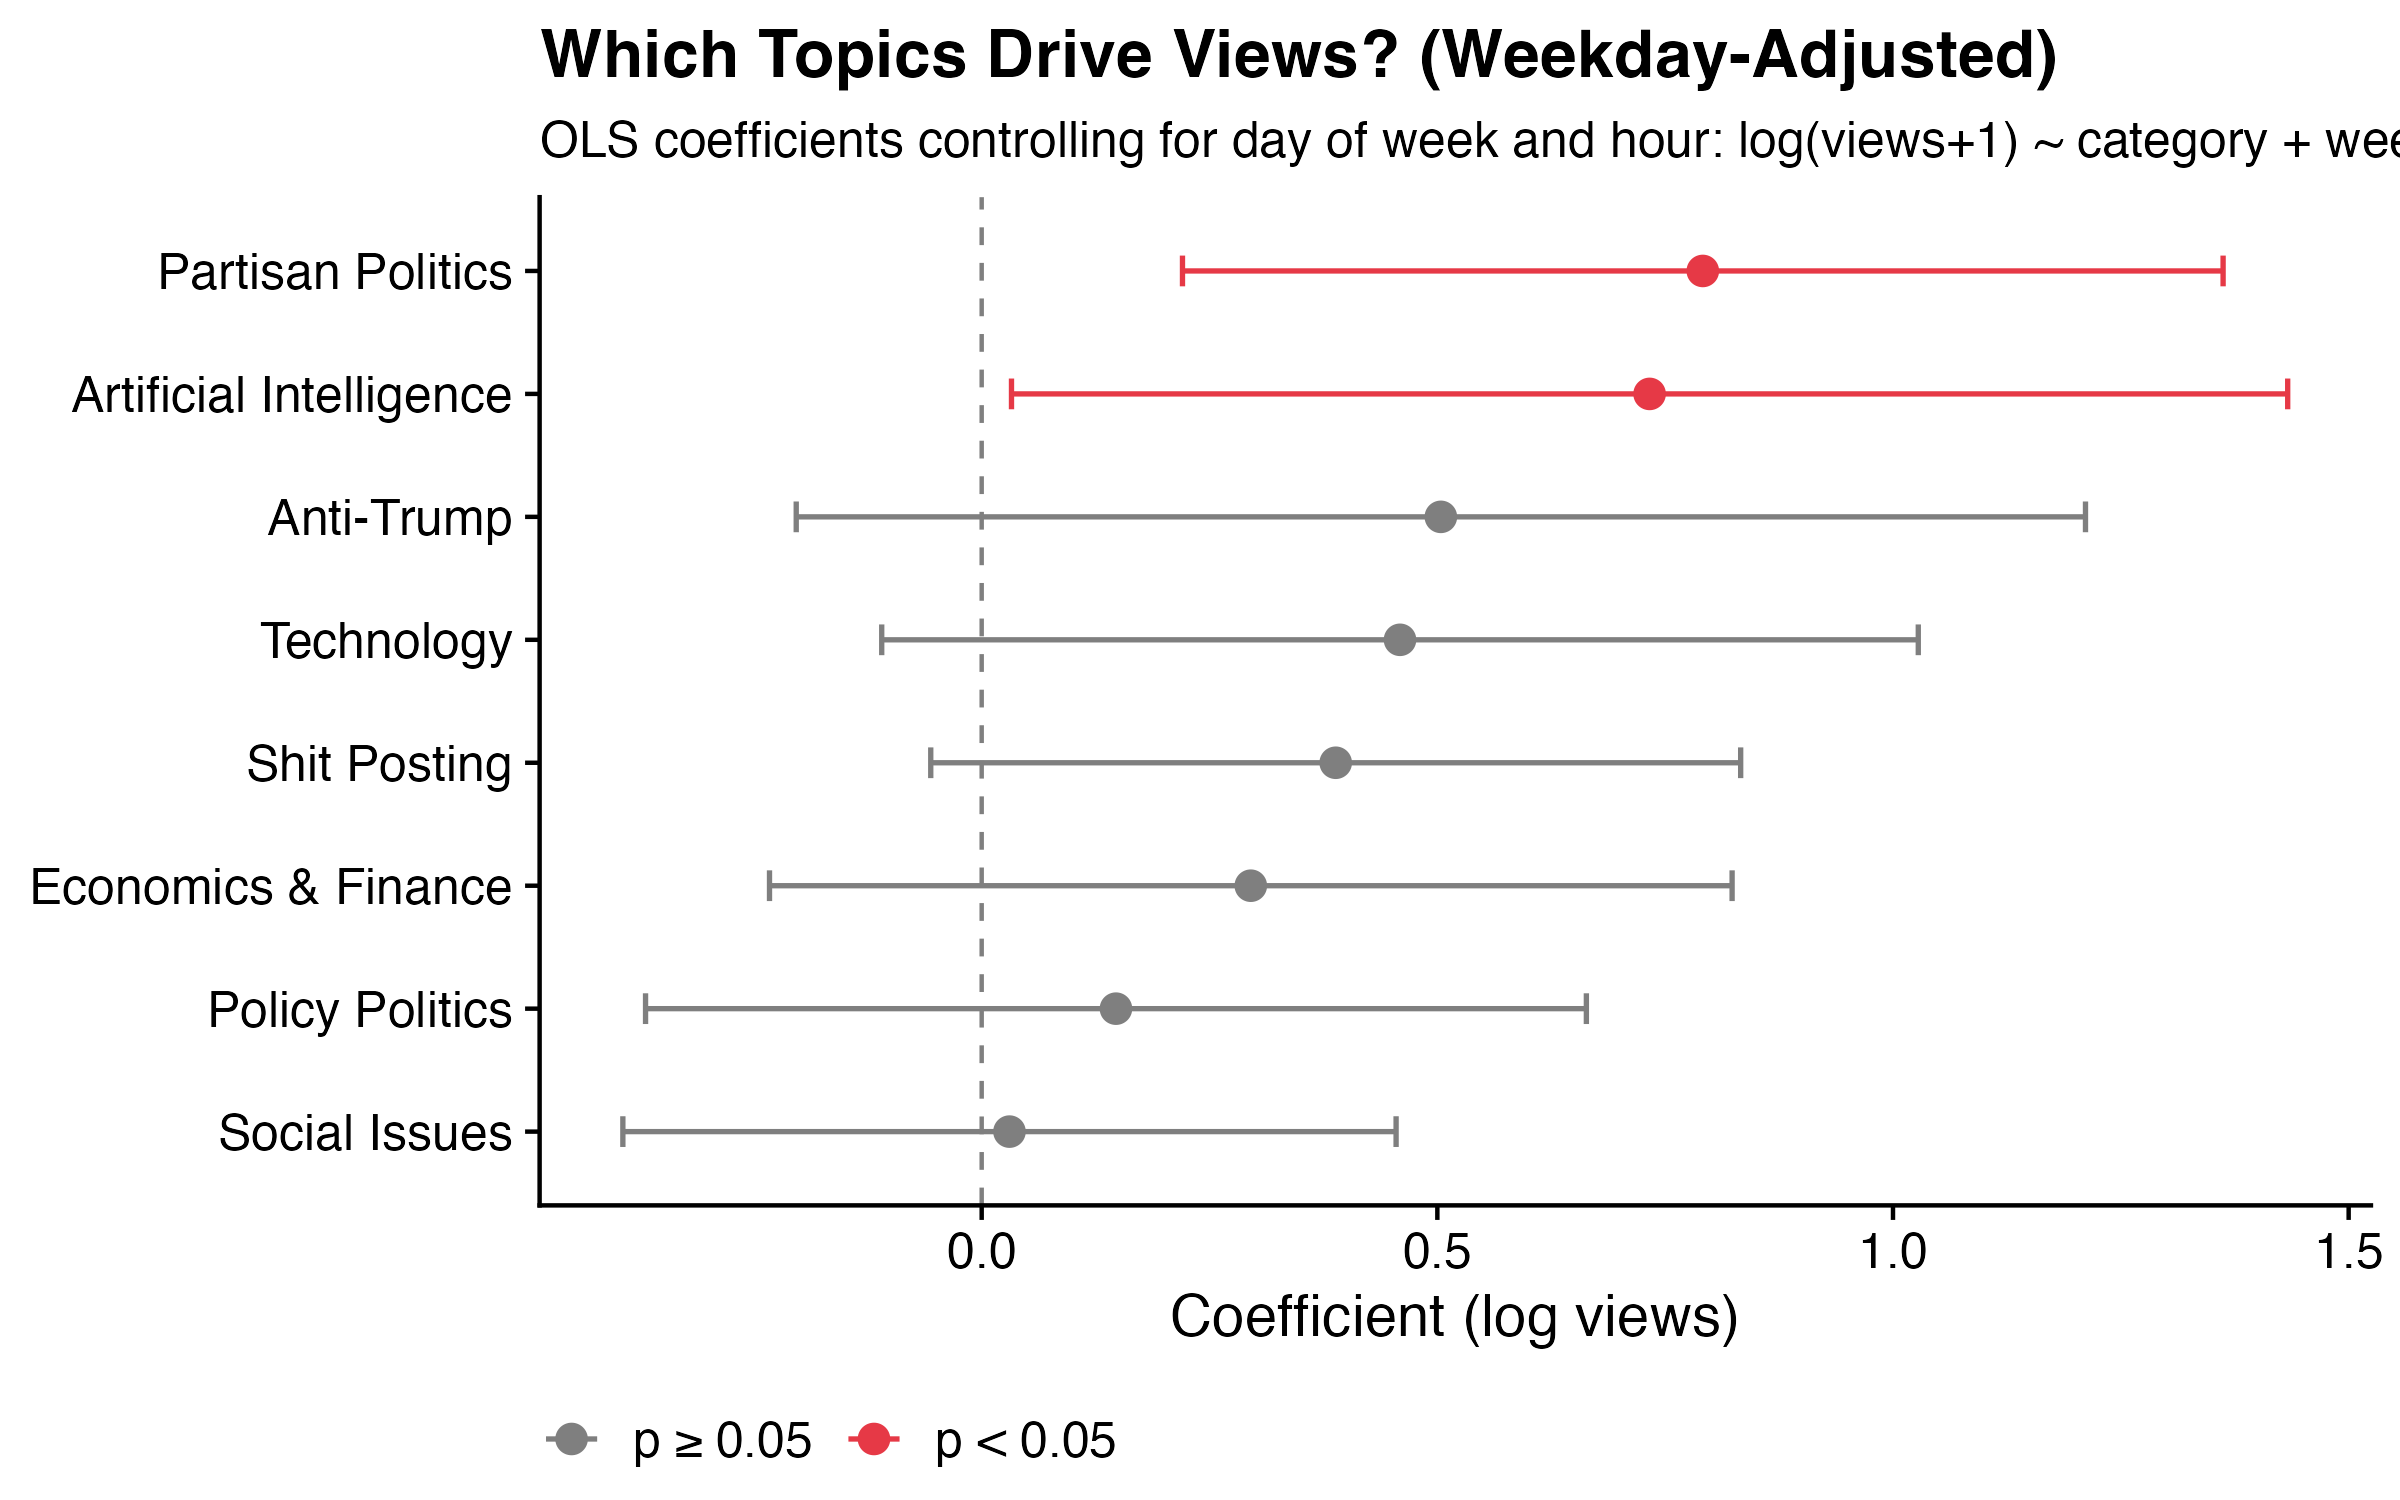
The chart below shows the coefficients from the views model, with 95% confidence intervals. Points in red are statistically significant (p < 0.05); grey points are not.
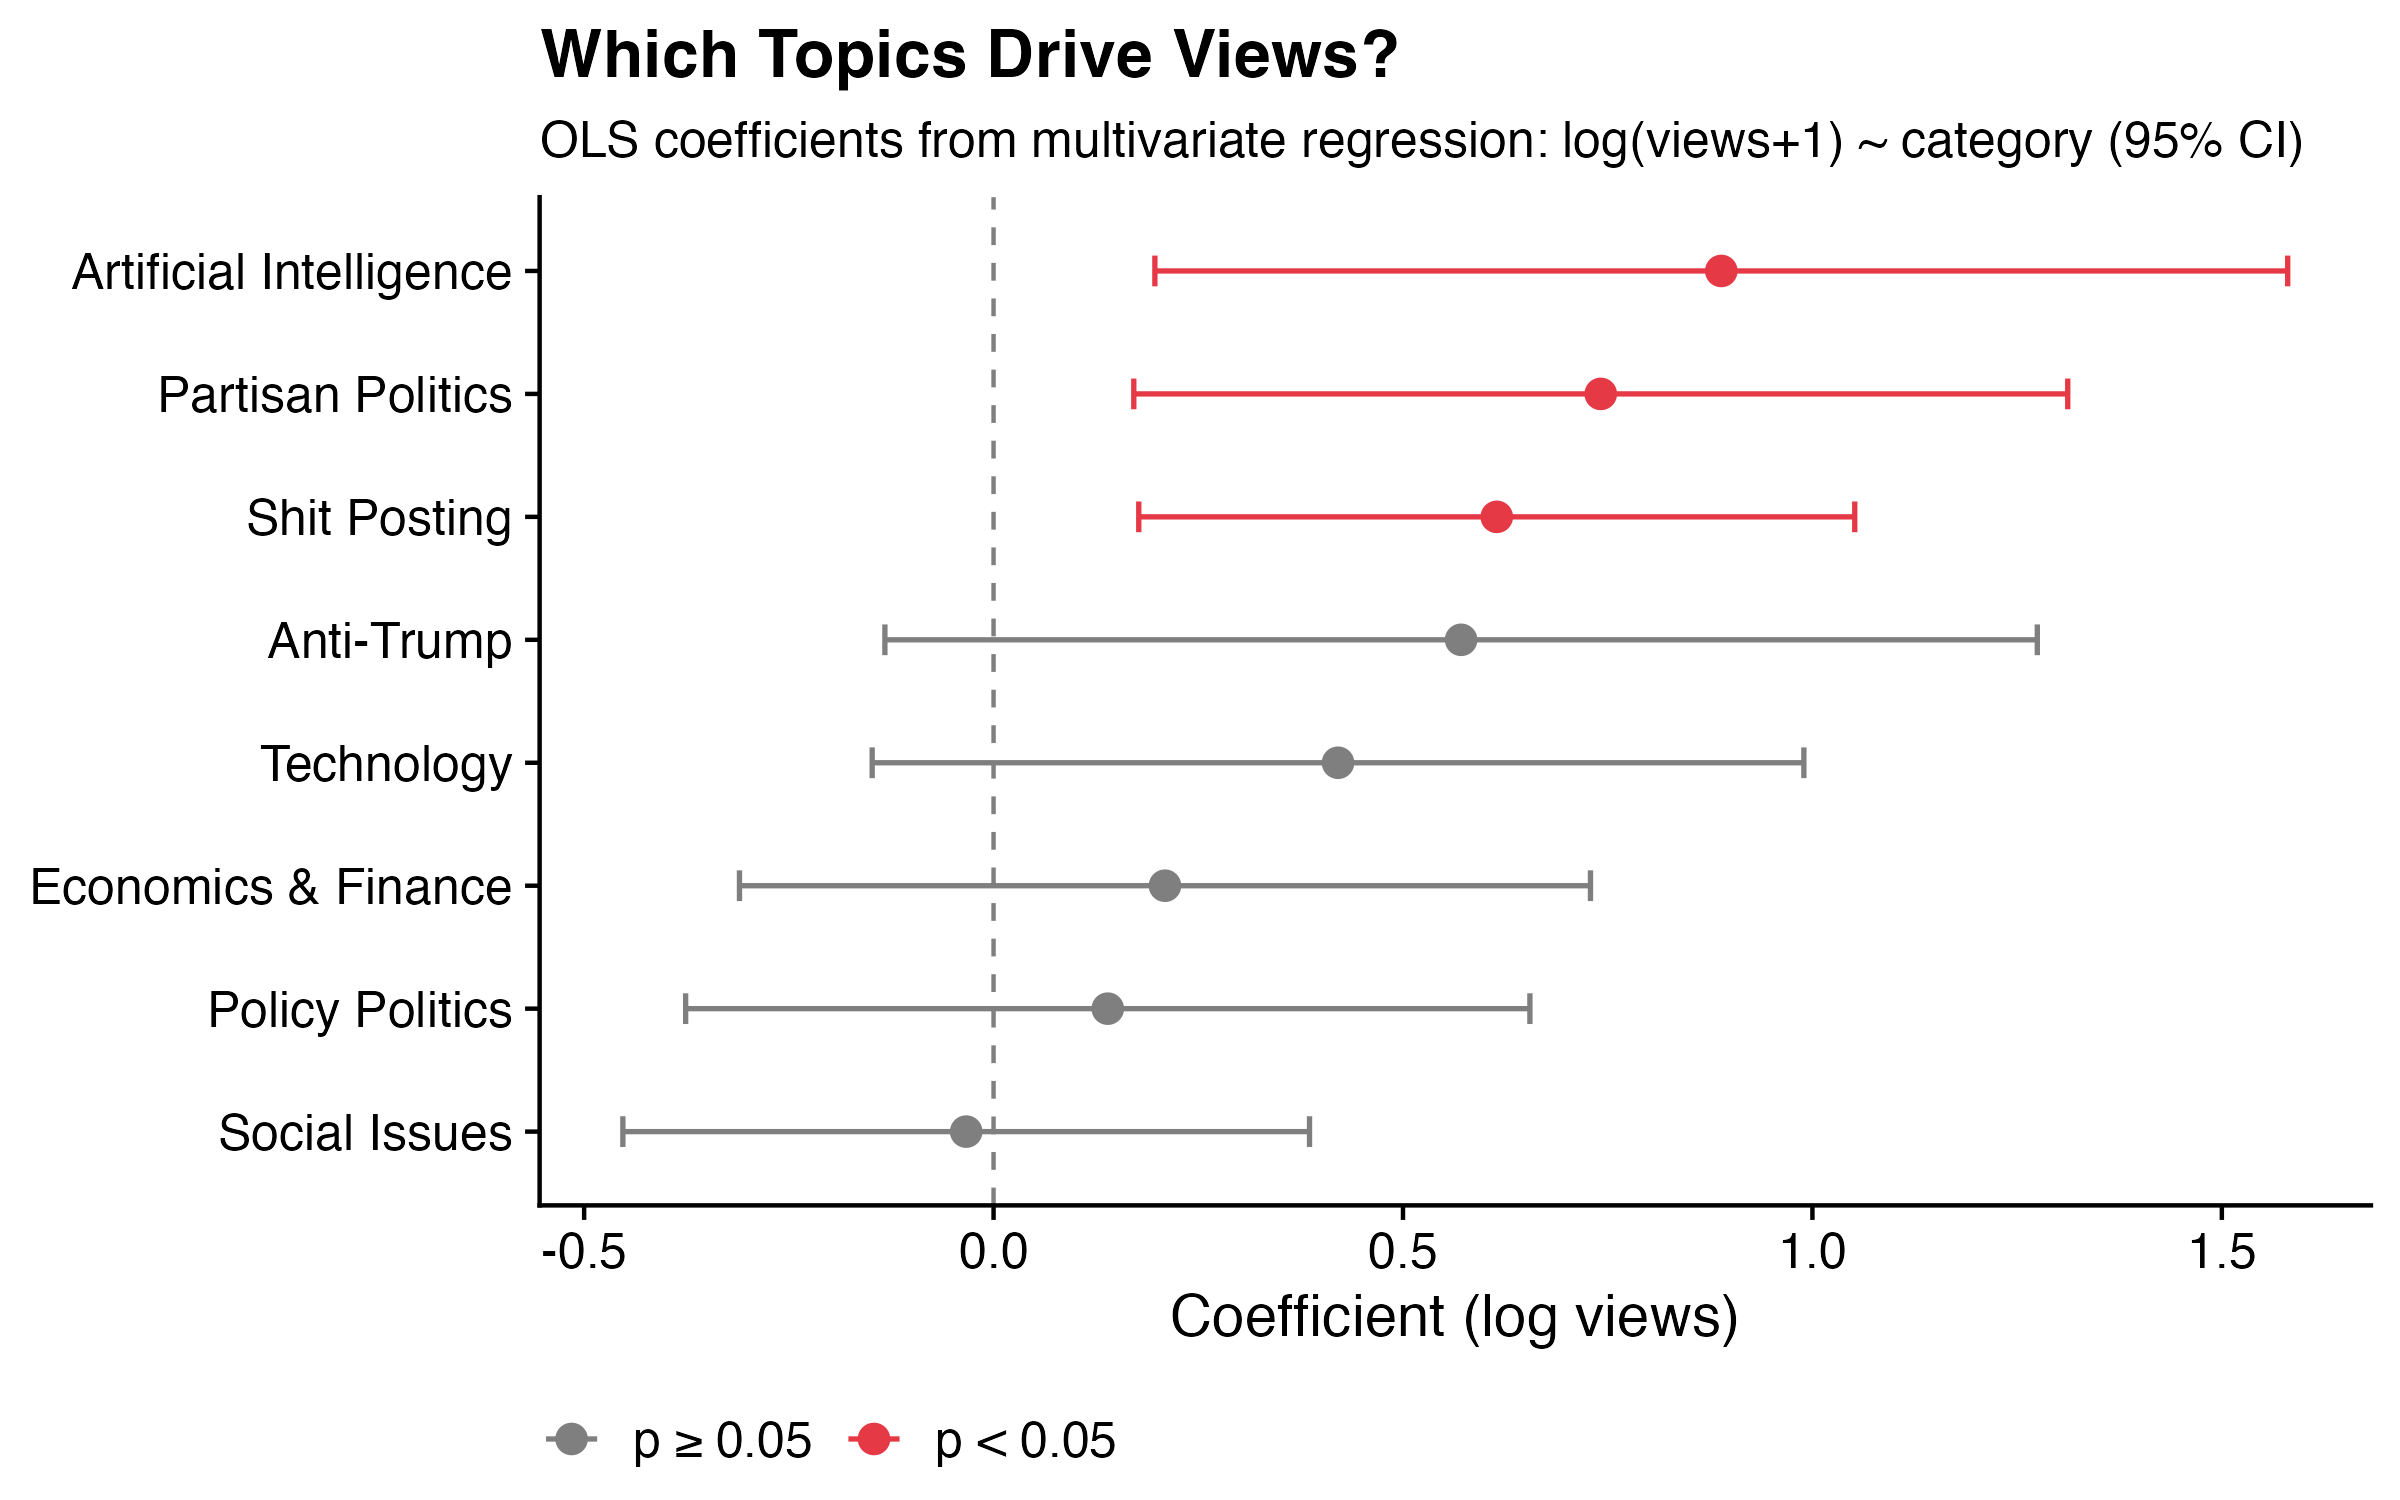
Three categories emerge as significant positive predictors of views (for the stats nerds: R² = 6.8%, F p = 2.5×10⁻⁶):
Artificial Intelligence is the single strongest predictor. Holding everything else constant, an AI post gets roughly 2.4x as many views as a comparable post on a different topic. AI has been the trendiest topic on the internet for the past two years, and the algorithm appears to reward it accordingly.
Partisan Politics comes in second. A partisan political post gets about 2x as many views as a comparable non-partisan post. Tribal political content travels well on social media — this surprises no one.
Shit Posting rounds out the significant predictors, with posts in this category getting about 1.8x as many views. Blunt, low-effort, instantly legible takes are apparently what the algorithm rewards. I have complicated feelings about this.
For likes, the story is similar but smaller in scale: partisan politics posts get about 50% more likes than comparable posts, and shit posts about 35% more. AI drops out entirely for likes — AI posts rack up views without proportionally converting to likes. Interesting.
For replies, no category made a meaningful difference. Nothing I post about reliably generates conversation, which is either a sign of epistemic humility or evidence that I am not as interesting as I think I am.
Topic explains only a small slice of overall engagement — most of what determines whether a post goes anywhere is timing, luck, and whether someone with a large following happens to engage. But the categories that do matter are consistent and interpretable.
One natural question is whether these effects are real or just a reflection of timing — maybe I happen to post AI content on Thursdays at peak hours, and it’s the timing doing the work rather than the topic. To check, I re-ran all models controlling for both day of week and hour of day.
The results held up for the most part. Partisan politics and AI posts still get roughly 2x as many views after accounting for when they were posted — those effects appear to be about the content itself. Shit posting weakens once timing is controlled for, suggesting some of its raw advantage was coming from when I tend to fire off a shit post rather than the content. The reply non-result holds throughout.
One more alternative explanation worth ruling out: volume. Maybe on high-output days I’m simply flooding my feed and one post happens to catch a wave — meaning it’s the quantity, not the quality of the content, doing the work. The chart below plots each post’s views and likes against the number of posts I made that day.
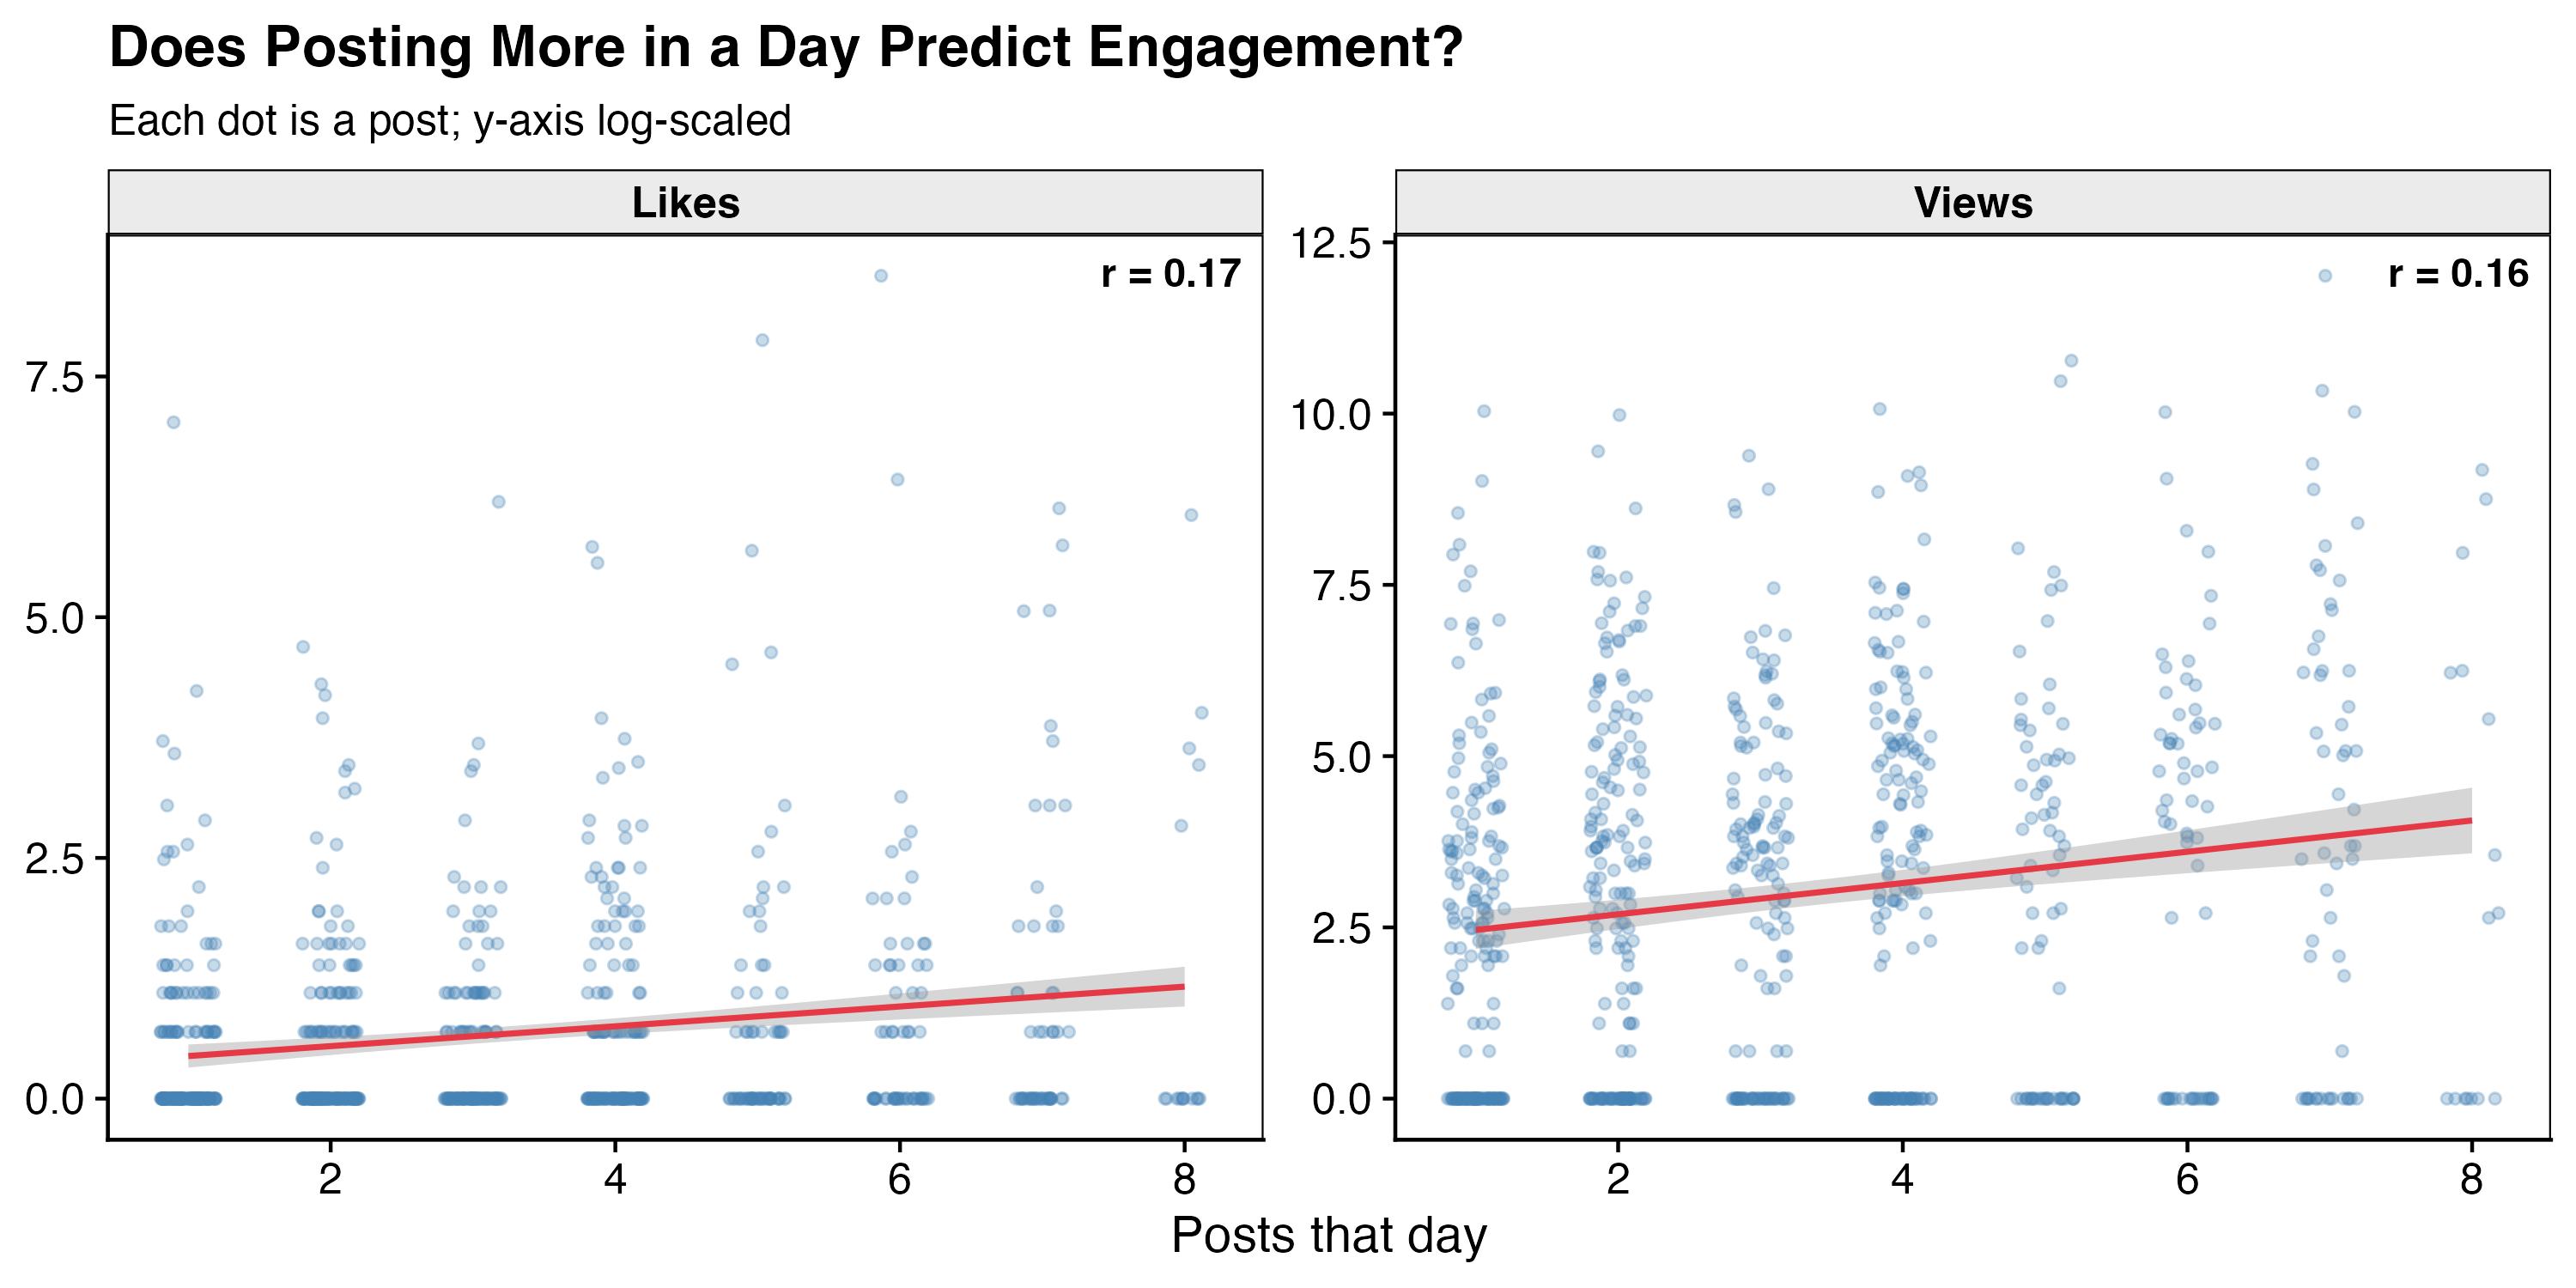
The correlations are r = 0.16 for views and r = 0.17 for likes — small but consistently positive, suggesting a weak connection. Posting more on a given day does seem to nudge individual post performance slightly, though the effect is modest enough that it’s unlikely to be the main story. The content effects from the models hold.
Bonus: Does the Day of the Week Matter?
One last question that the timestamp data makes easy to answer: does when I post matter?
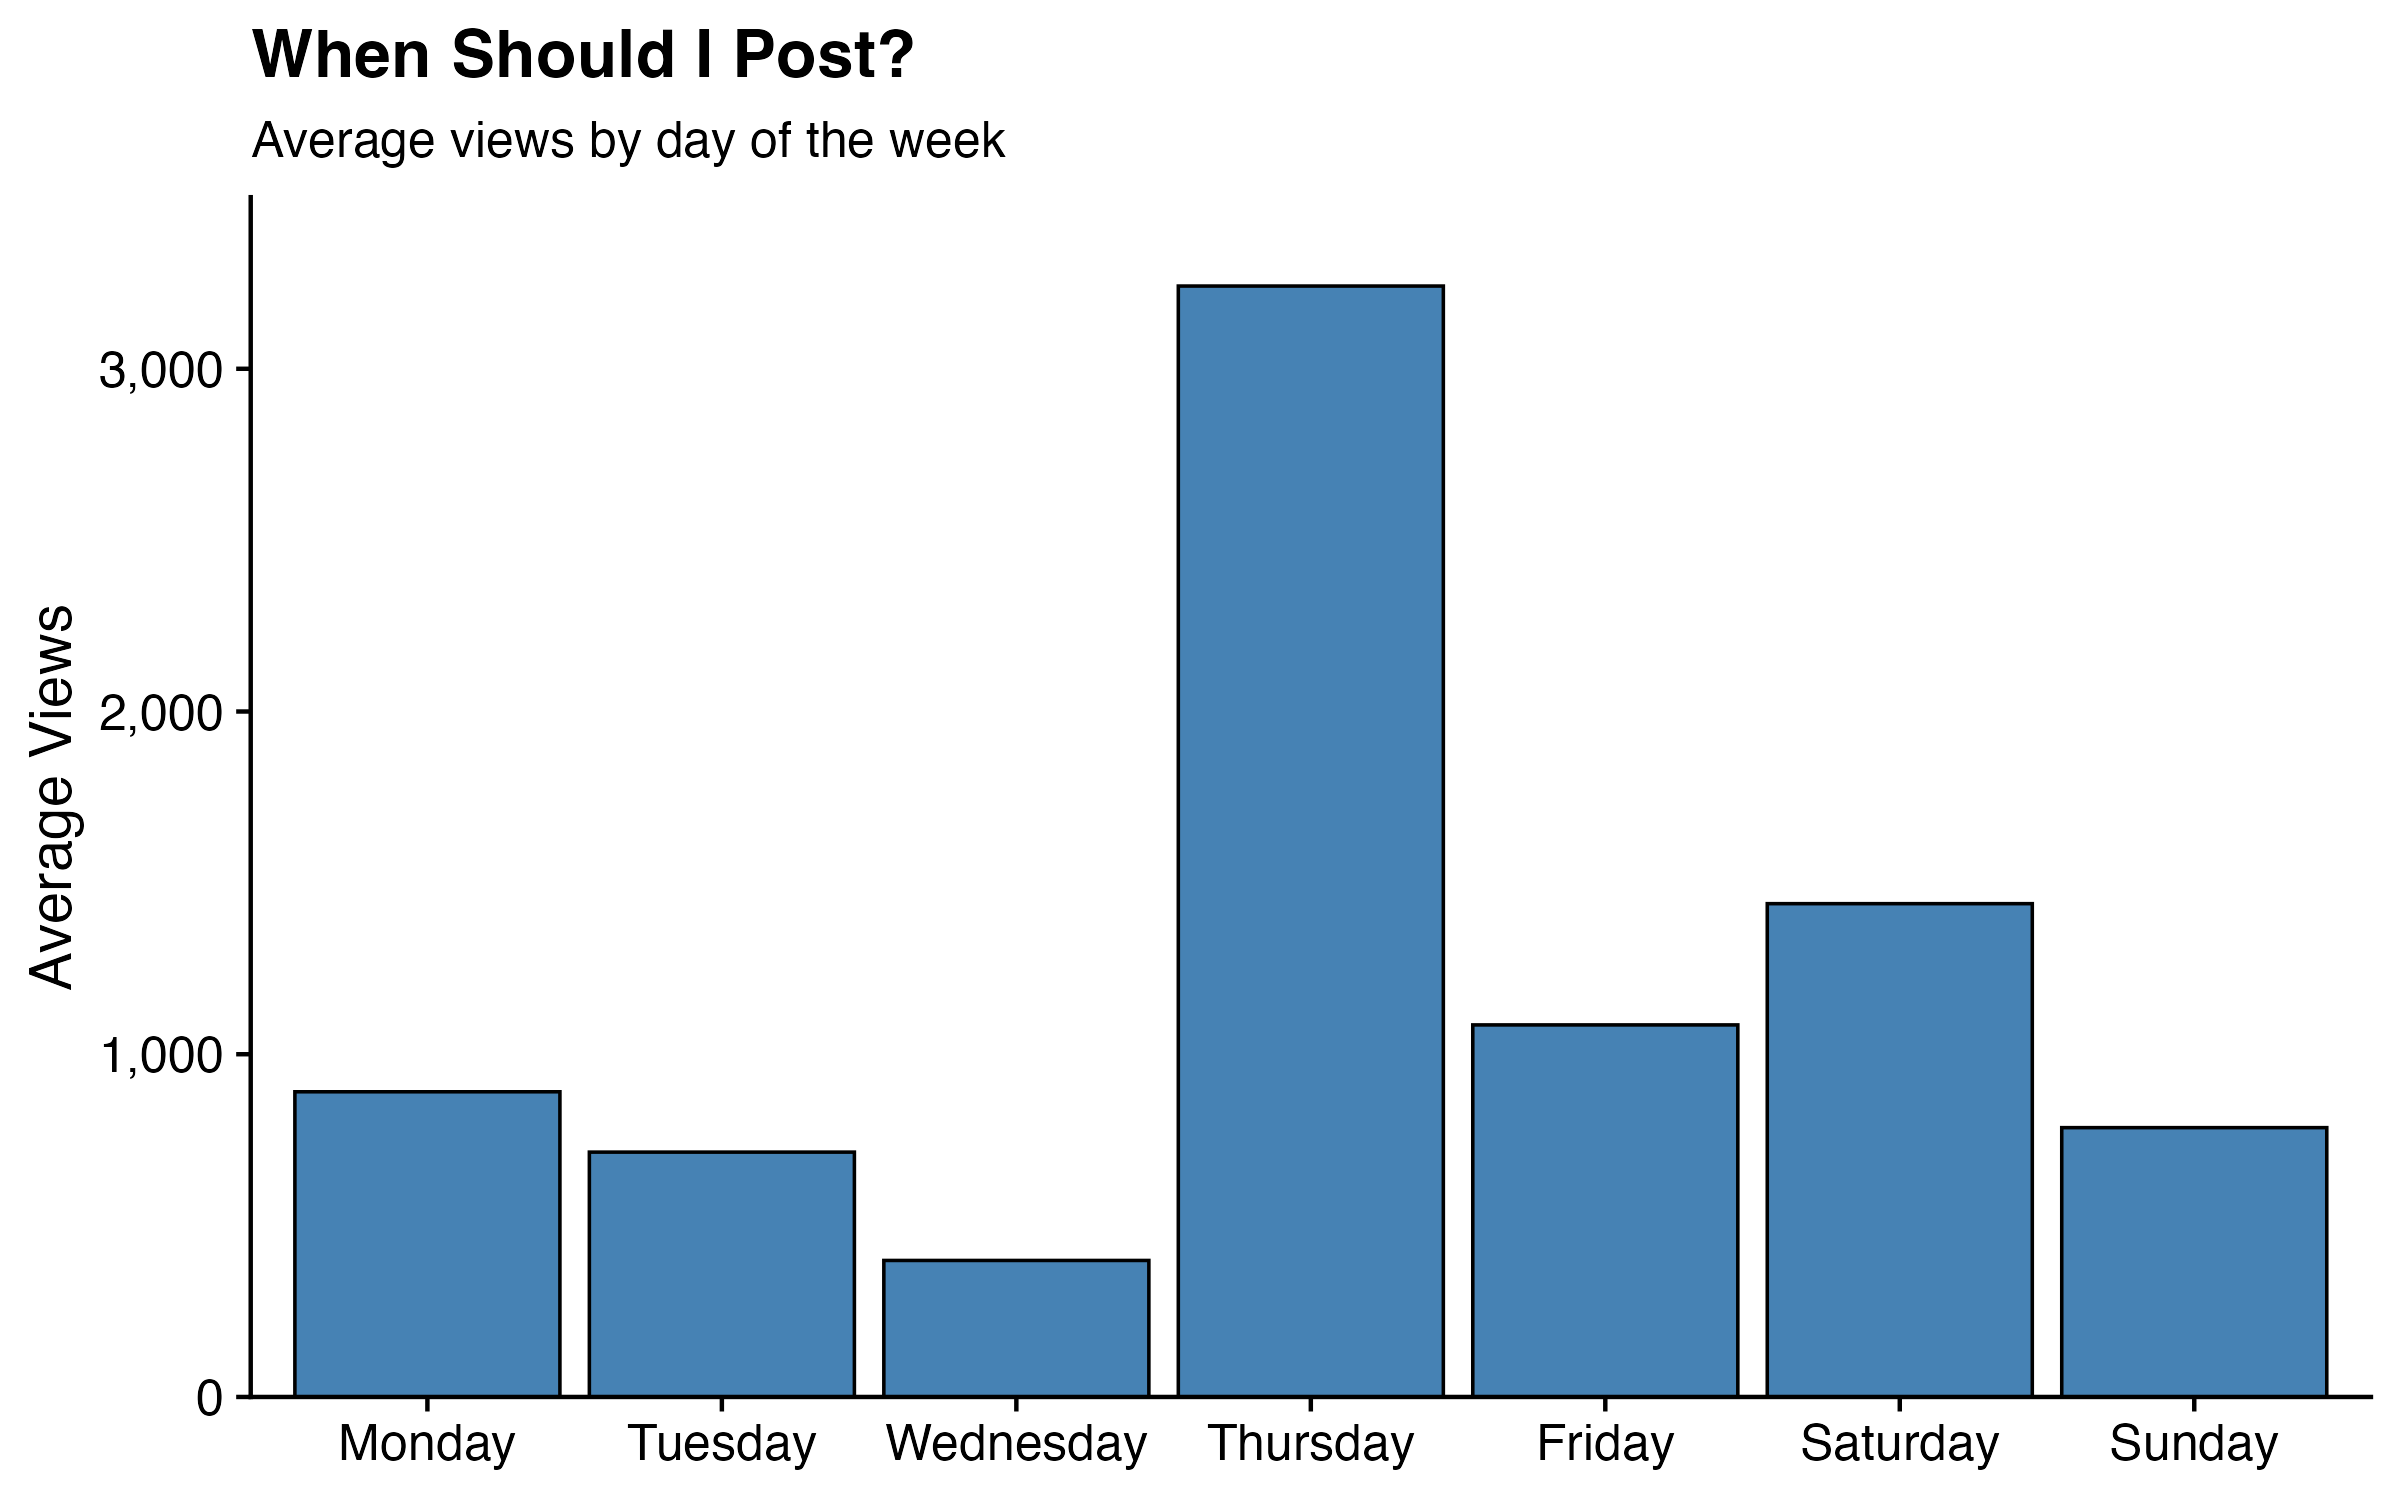
Thursday stands out immediately — average views of 3,241, more than double the next best day (Saturday at 1,439) and about four times Wednesday’s average of 398. Monday and Friday are middling. Wednesday is the worst day to post, by a wide margin.
I don’t have a strong theory for why Thursday in particular. It might be something about my posting behavior on Thursdays — maybe I tend to post more shareable content, or post at better times within the day. It might also just be noise: with 72–106 posts per weekday, a handful of viral Thursday posts could skew the average significantly. Either way, the answer to “when should I post?” appears to be: not Wednesday.
Time of day tells a cleaner story. The chart below breaks posts into five windows (Pacific Time):
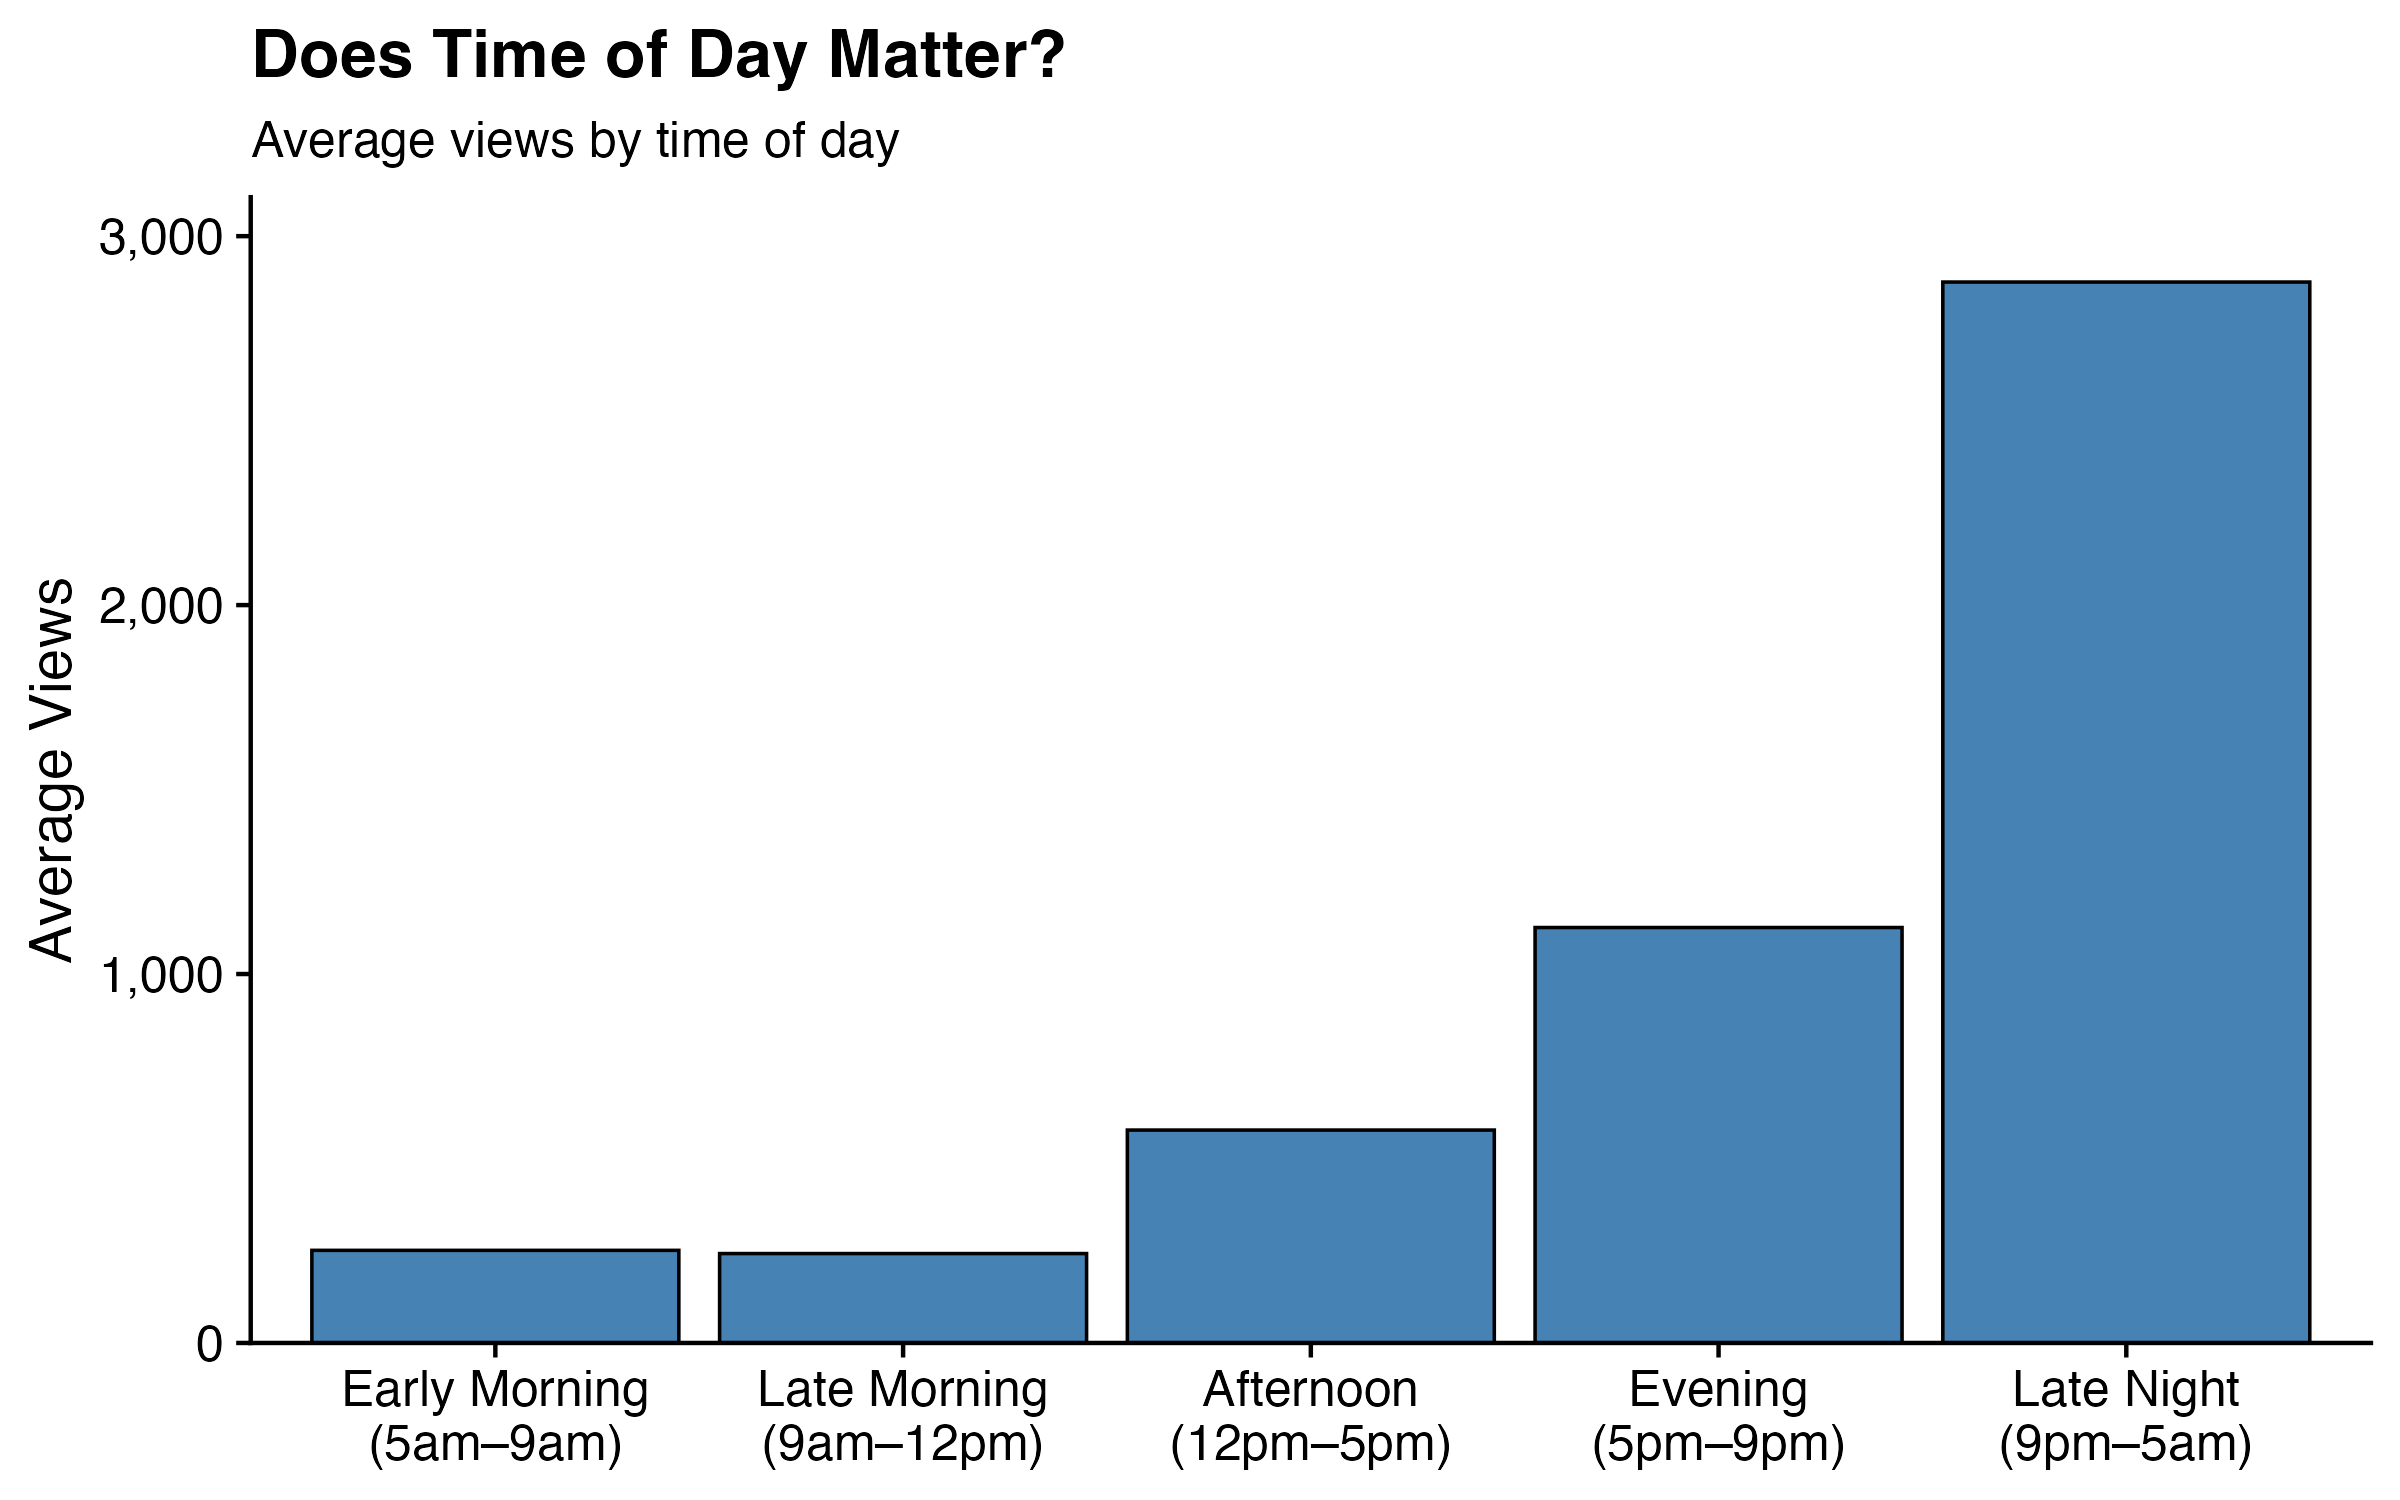
Late night posts (9pm–5am) average nearly 2,900 views — more than double the evening average of 1,126, and about twelve times the morning average of ~250. The pattern is monotonic: the later in the day, the more views. One plausible explanation is that late night is when I tend to post more impulsively about whatever’s dominating the news cycle, which also happens to be when more people are doom-scrolling. Another is that late night posts have more hours to accumulate views before I wake up and post something else that pushes them down. Either way, if I want views, apparently I should stay up later — which is not advice I needed the algorithm to give me.
Conclusion: Do This With Your Own Data
Everything in this post — pulling my data, discovering my categories, classifying 582 posts, and running the regressions — took a single afternoon. The data pull and classification itself ran in about 30 minutes; the rest was just analysis and writing. If you have a Threads account and a few API keys, you can run the same analysis on your own feed.
The most valuable step is explore() first. Don’t impose your categories from the top down. Run the exploration pass, look at what themes emerge with high frequency, and let your actual content tell you what it’s about. Your categories will be better for it, and you’ll probably learn something about yourself in the process that you wouldn’t have guessed going in.
From there, classify() gives you a labelled dataset you can take in any direction. A few starting points:
- Sentiment and tone. Instead of topic categories, define categories like “optimistic,” “cynical,” “ironic,” or “earnest.” You’ll get a mood profile of your posting history.
- Audience targeting. If you post for multiple audiences — say, researchers, practitioners, and general readers — define categories for each and see how your mix has shifted over time.
- Thread evolution. Classify posts by month and track how your topical distribution has changed. Are you posting more or less about AI than you were a year ago? The data will tell you.
- Quote extraction. Use
extract()instead ofclassify()to pull structured fields out of free text — named entities, specific claims, URLs, anything you want to turn into a column.
Beyond social media, the underlying engine is cat-llm, which was designed for survey and qualitative data. If you’re a researcher sitting on thousands of open-ended survey responses, interview transcripts, or product reviews, the same pipeline applies. Define your codebook as a set of verbose category descriptions, run classify(), and get back a coded dataset in minutes rather than weeks. The package supports multi-model ensembles, chain-of-thought reasoning, and automatic inter-rater reliability metrics: all the things you’d want for academic coding workflows.
If you want to adapt it for your own platform or use case, cat-llm is open source and built to be forked. cat-vader is one fork; there’s no reason there couldn’t be a cat-reddit, a cat-bluesky, or a cat-transcripts for interview data. The core classification and exploration logic is platform-agnostic. All you need to wire up is a data ingestion layer for whatever source you’re working with.
If you build something interesting with it, I’d genuinely like to hear about it. Reach out at chrissoria@berkeley.edu.
One last thing: I’ll be re-running this analysis in six months to see whether I’ve made good on my vow to reduce my shit posting. The pipeline takes an afternoon. The habit change may take longer.
How I Did It, and How You Can Too?
Want to run this on your own data? Here’s the technical setup.
Getting Started
cat-vader is available on PyPI:
pip install cat-vader
You’ll also need a Threads access token. Generate one via the Meta for Developers portal (create an app, add the Threads product, and generate a long-lived user token), then add it to a .env file:
THREADS_ACCESS_TOKEN="your-token-here"
THREADS_USER_ID="your-numeric-user-id"
cat-vader will pick these up automatically when you call any function with sm_source="threads". Alternatively, you can pass your API key directly as a parameter in any function call — the .env file is just a convenience for avoiding repetition.
If you already have social media data — a CSV of posts from any platform, a scraped dataset, a platform export — you can skip the API setup entirely and pass your text directly to classify(), explore(), or extract() via the input_data parameter. The sm_source integration is a convenience layer on top of the same classification engine.
Pulling My Threads History
For the Threads API pull: cat-vader connects to your account and retrieves your full post history — every post you’ve made, along with engagement metrics — automatically, without any manual data export. You authenticate once via the Threads Graph API, store your credentials in a .env file, and cat-vader handles the rest.
Under the hood, the package paginates through your full post history (the API returns up to 100 posts per page), fetches engagement metrics for each post in a separate insights call, and returns everything as a single tidy DataFrame with one row per post. Columns include the post text, image URL (when an image was attached), media type, and metrics: likes, views, replies, reposts, quotes, and shares.
The key parameter is sm_source="threads", which can be passed to any of the main functions — classify(), extract(), or explore(). You can scope the pull to a specific time window using sm_months:
import catvader as cv

# Pull and classify the last 12 months of your personal Threads history
results = cv.classify(
    sm_source="threads",   # connect to your Threads account
    sm_months=12,          # fetch all posts from the past year
    categories=["Politics", "Technology & AI", "Economics", "Health & Science",
                "Education & Research", "Culture & Entertainment",
                "Social Issues", "Personal"],
    api_key="your-openai-api-key",
)
Here are my five most-liked posts from the dataset:
| date | text | likes | views | replies |
|---|---|---|---|---|
| 2025-11-14 | Credit to Representative Robert Garcia for releasing the initial three emails from the Epstein emails. Dude is risking a lot. | 5,146 | 22,504 | 61 |
| 2025-02-17 | Testing my hypothesis that the algorithm will boost the word Costco. If this gets more than my usual 0 likes then the null is rejected. Costco Costco Costco… | 2,637 | 35,387 | 36 |
| 2025-01-12 | Alex Jones was posting on X that L.A. firefighters were battling the blazes using ladies’ handbags as buckets because officials had donated equipment to Ukraine… | 1,123 | 8,235 | 127 |
| 2025-09-24 | Did you all notice how your collective action just “overpowered” Trump and got Jimmy Kimmel back on the air? | 619 | 8,517 | 67 |
| 2025-01-24 | The United State of California has a good ring to it. | 491 | 7,305 | 50 |
For my account, pulling my full history returned 850 posts going back to July 2023, about two and a half years. Of those, 176 were image posts, 5 were videos, and 582 had text content; the remainder were reposts or media-only posts.
One note on the metrics: the Threads Insights API takes a few hours to populate data for brand new posts, so very recent posts may show zeros. Older posts return accurate lifetime totals.